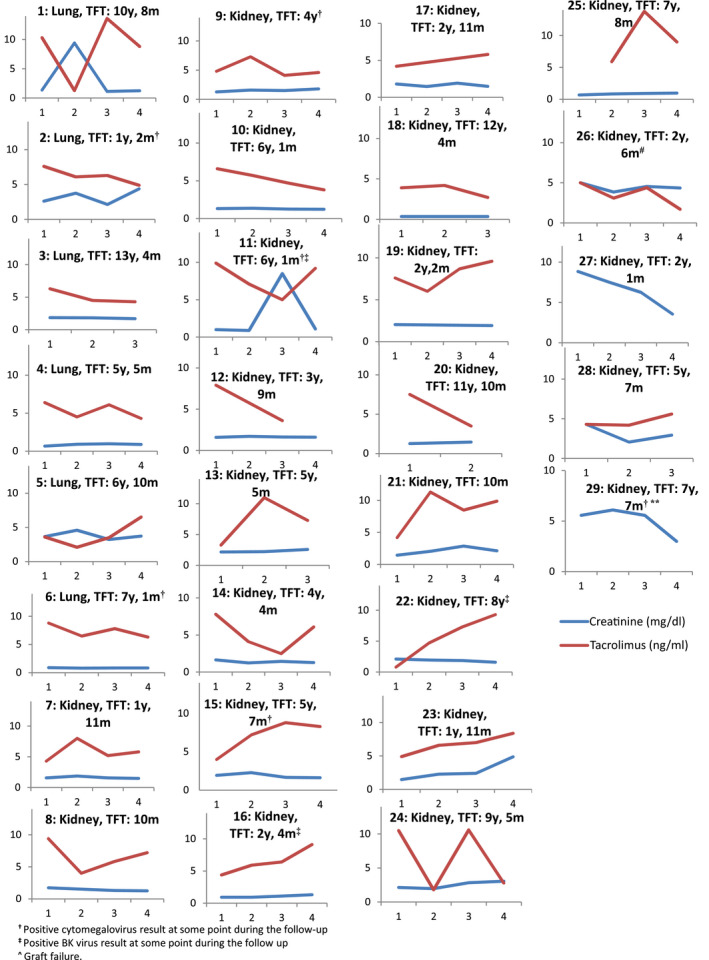
FIGURE 1.

Creatinine and tacrolimus trough plasma concentration of SOT recipients during the follow up (X axis represent the correlative number of blood sample during the follow up, m: month, SOT: solid organ transplantation, TFT: time from transplantation, y: years). Patients 27 and 29 did not receive tacrolimus
