
Fig. 1.
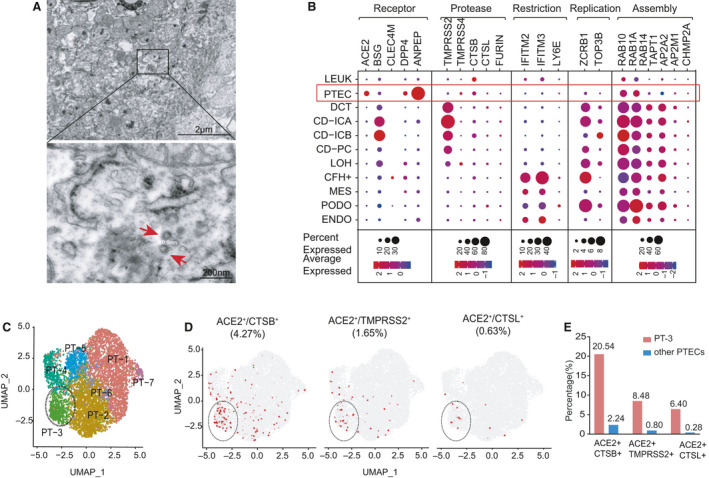
Gene expression profile of host factors related to SARS‐CoV‐2 infection in normal human kidneys (GSE131882). (A) Electron microscopy from autopsy kidney specimens of COVID‐19 patients showing cytoplasm of proximal tubules containing spherical particles measuring around 80 nm (arrow) and surrounded by spikes. (B) Dot plot showing expression patterns of host factors within 11 cell types in the kidneys (sample size = 3). Dot size indicates the proportion of cells expressing a gene within particular cell types, and color intensity indicates the average gene expression level (blue to red denotes low to high expression). CFH+, complement factor H; ENDO, endothelium; IC, intercalated cell; LEUK, leukocyte; LOH, loop of Henle; PC, principal cell. Restriction, restriction factors; Replication, factors engaged in viral replication; Assembly, factors engaged in viral assembly. (C) UMAP plot displaying seven subclusters of PTECs identified by unsupervised clustering analysis, which have been distinctively colored and labeled (PT‐1 to PT‐7). (D) Feature plots displaying distribution of ACE2+/CTSB+ cells, ACE2+/TMPRSS2+ cells, and ACE2+/CTSL+ cells over the UMAP of PTEC subclusters. ACE2 and proteases co‐expressing PTECs are colored as red. (E) Histograms showing the percentage of ACE2+/CTSB+ (left panel), ACE2+/TMPRSS2+ (middle panel), and ACE2+/CTSL+ (right panel) cells in PT‐3 cells and other PTEC subtypes.