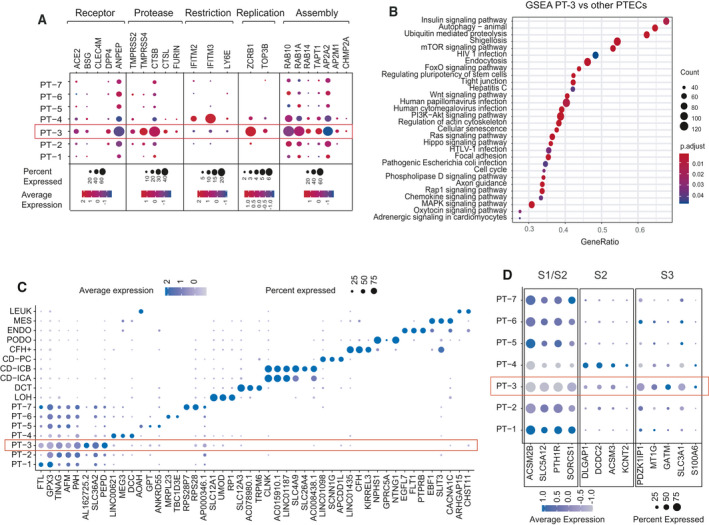
Fig. 2.

Characterization of PT‐3 cells that may be highly susceptible to SARS‐CoV‐2 infection. (A) Dot plot showing expression intensity and density of host factors within seven PTEC cell subtypes. (B) Dot plot showing enriched KEGG pathways of differentially expressed genes between PT‐3 cells and other PTECs by GSEA analysis. (C) Dot plot showing signature genes of different kidney cell types and PTEC subtypes. Dot size represents proportion of cells expressing a gene within respective cell subtypes. Darker indicates higher expression levels. (D) Expression pattern of marker genes for three segments (S1–S3) of proximal tubule in seven PTEC subclusters. Dot size represents proportion of cells expressing a gene within respective cell subtypes. Darker indicates higher expression levels.
