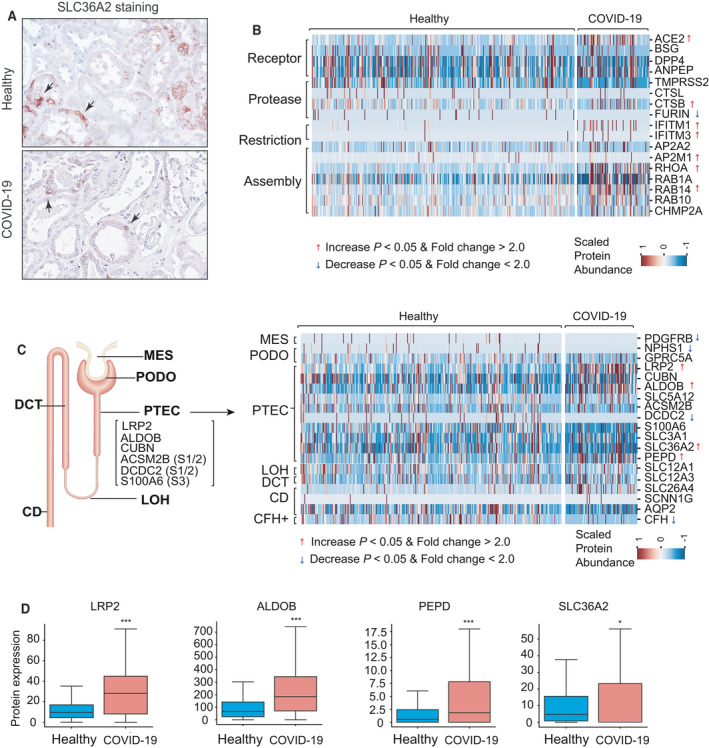
Fig. 3.

Urinary proteomic profiles of healthy individuals and COVID‐19 patients. (A) Immunohistochemistry staining showing the distribution of PT‐3 marker protein SLC36A2 in proximal tubules from control (upper panel) and patient with COVID‐19 (lower panel). Arrow indicates SLC36A2‐positive PTECs. (B) Heatmap showing protein abundance changes in host factors in urine samples of healthy individuals (n = 350) and COVID‐19 patients (n = 97). The color scale represents the protein abundance. Red arrow indicates increased proteins in urine of COVID‐19 patients (Mann–Whitney U‐test P < 0.05, fold change > 2.0). Blue arrow indicates decreased proteins in urine of COVID‐19 patients (Mann–Whitney U‐test P < 0.05, fold change > 2.0). (C) Left panel: A schematic representation of nephron showing the signature genes for PTECs and markers of three segments (S1–S3) of proximal tubule. Right panel: Heatmap showing differences in urinary protein abundance of cell type‐specific markers between healthy individuals and COVID‐19 patients. (D) Boxplots displaying medians (midline), interquartile range (IQR) (box), 1.5× IQR (whisker) of marker proteins levels of PTECs and PT‐3 cells in healthy individuals and COVID‐19 patients. Mann–Whitney U‐test, *P < 0.05, ***P < 0.001.
