
Fig. 4.
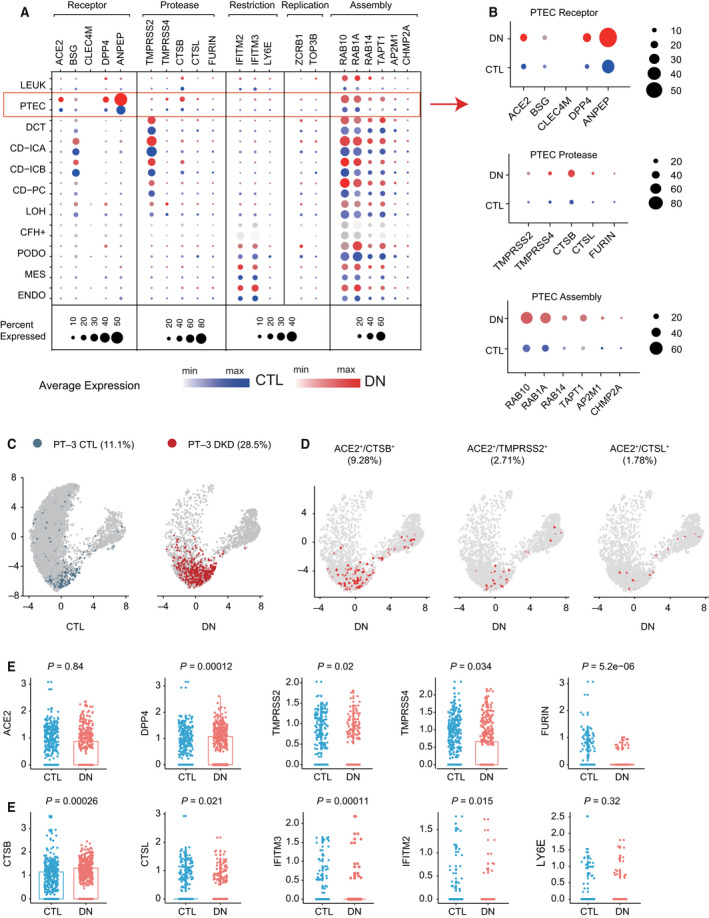
Single cell expression profiling of host factors related to SARS‐CoV‐2 infection in diabetic kidneys. (A) Dot plot showing the expression patterns of host factors in all cell types from normal kidney controls (in blue, sample size = 3) and diabetic kidneys (in red, sample size = 3). Dot size represents the percentage of cells expressing a gene within the cell cluster. CTL, control. (B) Dot plots showing the expression levels of ACE2, cellular proteases and factors related to virus assembly in PTECs of controls (in blue) and DN patients (in red). (C) Feature plot showing distribution and number differences in PT‐3 cells over the UMAP of PTEC subclusters from controls (in blue) and DN patients (in red). (D) Feature plot showing distribution of ACE2+/CTSB+ cells, ACE2+/TMPRSS2+ cells, and ACE2+/CTSL+ cells over the UMAP of PTECs from DN patients. ACE2 and proteases co‐expressing PTECs are colored as red. (E) Scatter‐box plots illustrating the average expression levels of host factors in PT‐3 cells. Comparisons between DN and controls were performed using Mann–Whitney U‐test. The significance level was set as 0.05.