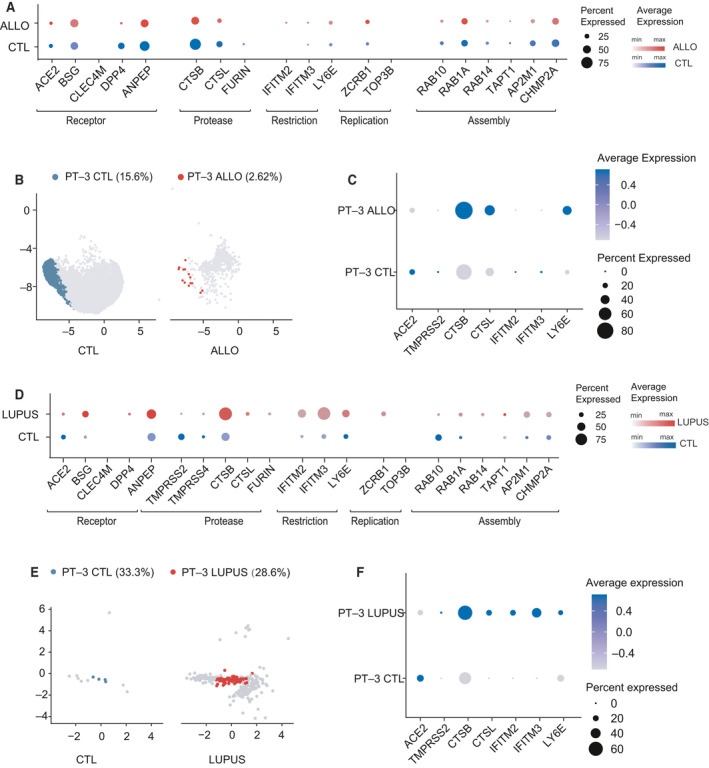
Fig. 5.

Single cell expression profiling of host factors in kidney allograft and lupus nephritis kidneys. (A) Dot plot showing the expression patterns of host factors in PTECs from normal kidneys (in blue, sample size = 19) and kidney allografts (in red, sample size = 5). Dot size represents the proportion of cells expressing a gene within the cell cluster. CTL, control; ALLO, kidney allograft. (B) Feature plot showing changes in distribution and proportion of PT‐3 cells over the UMAP of PTEC subclusters from controls (in blue) and kidney allograft (in red). (C) Dot plot showing the expression pattern of ACE2, proteases and restriction factors in PT‐3 cells from kidney allografts and normal kidneys. Dot size represents the proportion of cells expressing a gene within the cell type. Darker indicates higher expression level. (D) Dot plot showing the expression patterns of host factors in PTECs from control kidneys (in blue, sample size = 3) and LN kidneys (in red, sample size = 21). Dot size represents the proportion of cells expressing a gene within the cell cluster. CTL, control; LUPUS, lupus nephritis. (E) Feature plot showing difference in distribution and proportion of PT‐3 cells over the UMAP of PTEC subclusters from controls (in blue) and LN patients (in red). (F) Dot plot showing the expression pattern of ACE2, proteases and restriction factors in PT‐3 cells and other PTECs from LN kidneys. Dot size represents the proportion of cells expressing a gene within the cell type. Darker indicates higher expression level.
