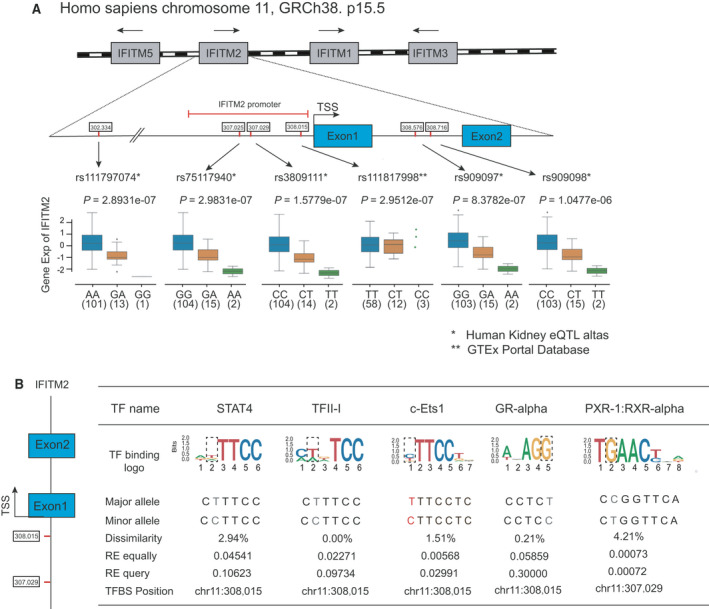
Fig. 6.

eQTLs associated with IFITM2 transcript expression level in human kidney. (A) Schematic representation of four genes (IFITM1, IFITM2, IFITM3, and IFITM5, in gray) located in one IFITM locus in chromosome 11p15.5. The blue boxes represent the exons of IFITM2 gene, and red marks represent the position of six eQTL‐SNPs for IFITM2 detected in the two databases. Box plots below show the normalized IFITM2 gene expression levels related to SNP genotypes, and the P value for each eQTL association. TSS, transcription start sites. (B) Sequence logo plots visualizing TFBS of transcription factors could be disrupted by SNP rs3809111 and SNP rs111817998 in the promoter of the IFITM2 gene.
