
FIGURE 2.
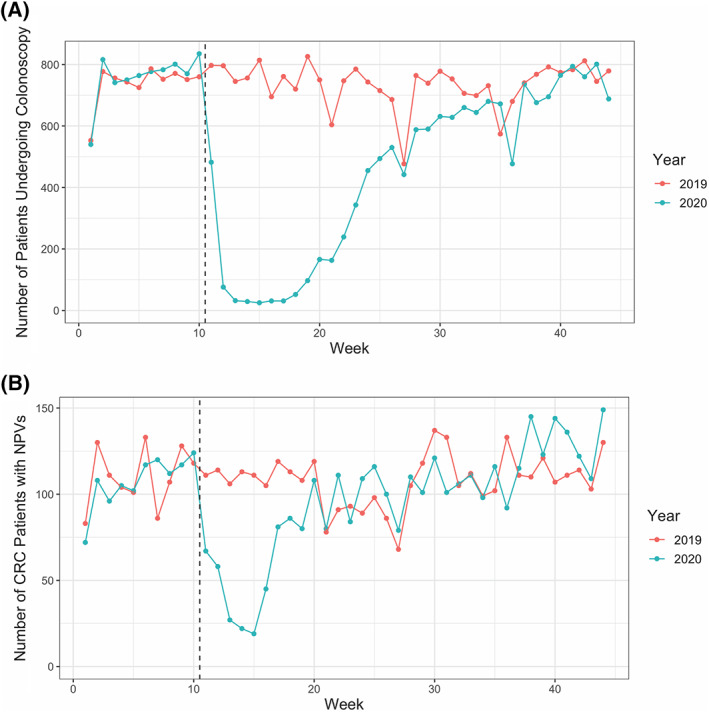
Observed changes in colonoscopy frequency during the early pandemic period. (A) A graphical representation of the number of patients receiving a colonoscopy in a given week in 2019 or 2020. (B) A graphical representation of the number of patients who had a NPV for CRC in a given week in 2019 or 2020. The dashed vertical line in both A and B corresponds to the beginning of the pandemic period in 2020