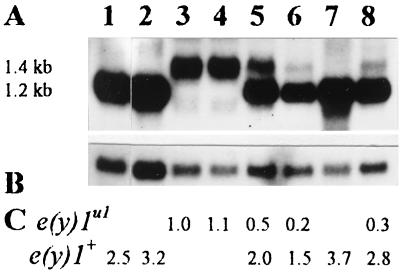
FIG. 1.
Transcription of the e(y)1u1 and e(y)1+ genes. (A) Northern blot hybridization of the fragment of e(y)1/TAFII40 cDNA (Fig. 2A) with mRNA from Oregon R males (lane 1), Oregon R embryos (lane 2), e(y)1u1/Y males (lane 3), e(y)1u1/e(y)1u1 females (lane 4), e(y)1u1/e(y)1+ females (lane 5), embryos from the ♀ e(y)1u1/e(y)1+ × ♂ e(y)1u1/Y cross (lane 6), C(1)RM,1yf females (lane 7), and embryos from the ♀ C(1)RM,yf × ♂ e(y)1u1/Y cross (lane 8). (B) The same blot hybridized with the Ras2 probe. (C) Relative level of e(y)1/TAFII40 transcription. The Northern blot was analyzed on a PhosphoImager; signals were normalized according to the results of Ras2 hybridization. The level of transcription in e(y)1u1/Y males was taken as 1.

