FIGURE 2.

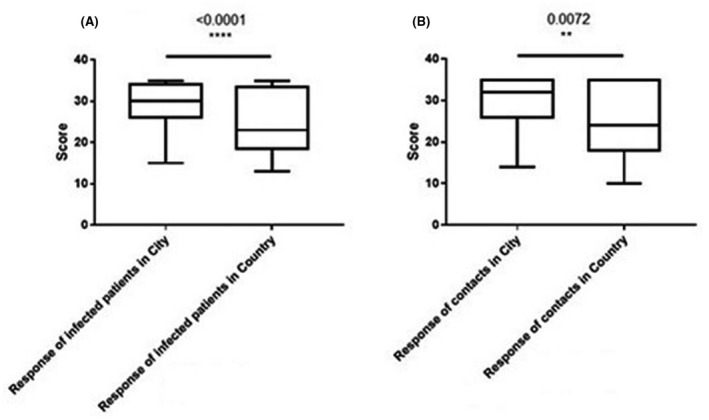
Box plots showing the overall response and awareness scores during the three questionnaires between (A) infected patients in the city compared with the country, and (B) contacts people in the city compared with the country

Box plots showing the overall response and awareness scores during the three questionnaires between (A) infected patients in the city compared with the country, and (B) contacts people in the city compared with the country