
FIGURE 3.
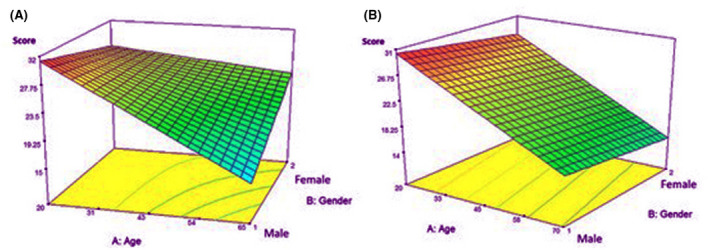
A response surface plot represents the relationship between age and gender compared with the total score for both groups; (A) for contacts, (B) for patients
Official websites use .gov
A
.gov website belongs to an official
government organization in the United States.
Secure .gov websites use HTTPS
A lock (
) or https:// means you've safely
connected to the .gov website. Share sensitive
information only on official, secure websites.
A response surface plot represents the relationship between age and gender compared with the total score for both groups; (A) for contacts, (B) for patients