FIGURE 4.

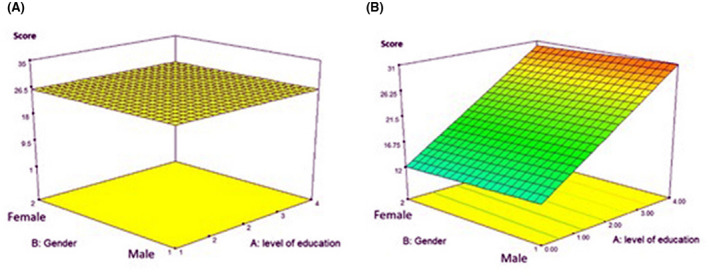
A response surface plot represents the relationship between gender and level of education (the higher the level of education the higher the encoded number) compared with the total score for both groups; (A) for contacts, (B) for patients

A response surface plot represents the relationship between gender and level of education (the higher the level of education the higher the encoded number) compared with the total score for both groups; (A) for contacts, (B) for patients