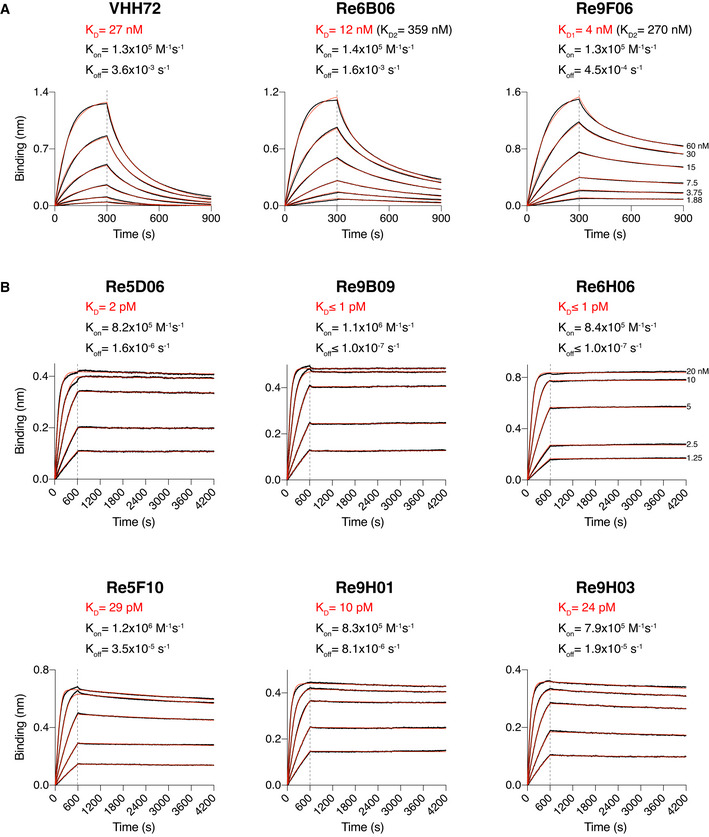
Figure 2. Affinities of VHH antibodies for the RBD, determined by bio‐layer interferometry (BLI).

- SARS‐CoV‐2 RBD‐loaded sensors were incubated with nanobodies at the indicated concentrations for 300 s, followed by dipping in assay buffer for 600 s. The response curves (black) were fitted using either a 1:1 (for VHH‐72) or 2:1 (for Re6B06 and Re9F06) binding models to obtain KDs. Fitted curves are shown in red. For Re6B06 and Re9F06, some secondary binding with weaker affinity at high VHH concentrations was observed (denoted as KD2).
- Nanobody‐loaded sensors were dipped into wells containing RBD at the indicated concentrations for 600 s and then incubated with assay buffer for 1 h. The response curves (black) were fitted using a mass transport model. Fitted curves are shown in red.
