
Fig. 3.
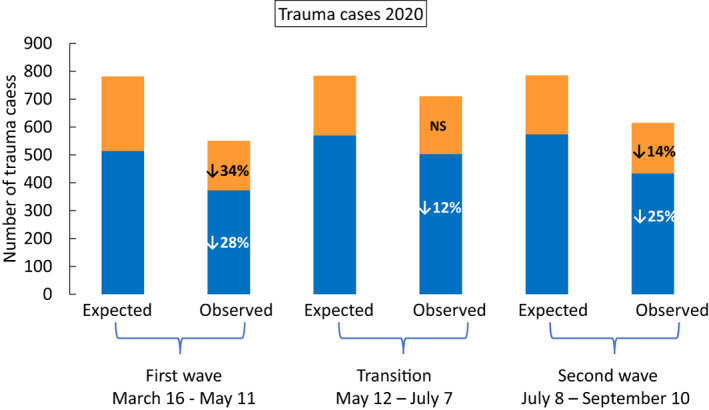
Minor (blue,  ) and major (orange,
  ) trauma cases presenting to the Royal Melbourne Hospital during our three periods of interest: March to May (wave 1), May to July (transition) and July to September (wave 2). The number of expected (modelled from case numbers in 2016–2019) and observed cases in 2020 are shown, with the percent deviation from what was expected indicated in text in the observed columns.