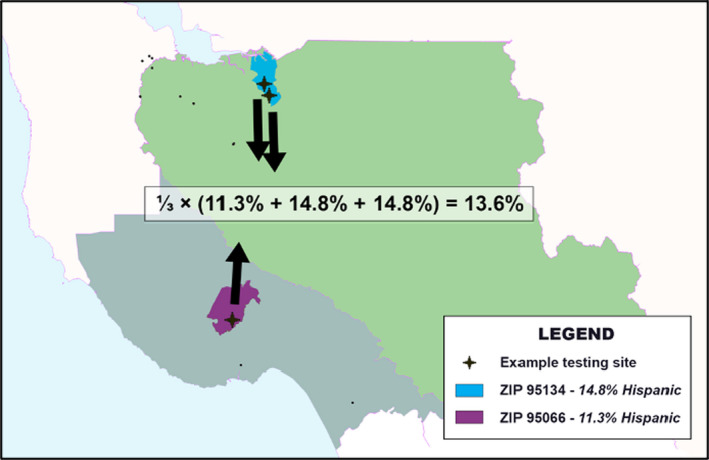
FIGURE 1.

Demonstration of aggregate proportion calculation with three arbitrary testing sites. Three testing sites in California were arbitrarily chosen to demonstrate how the aggregate proportion in ZCTAs around testing sites is calculated. The Hispanic proportion was calculated for just these three sites. One site is in zip code 95066 (purple), which is 11.3% Hispanic. The other two sites are in zip code 95134 (blue), which is 14.8% Hispanic. For these three sites, the aggregate proportion is 13.6 per cent. In this study, all testing sites in the state or the country would be aggregated in this way for both the empirical and simulated testing distributions. The empirical aggregate proportion is compared to the mean‐simulated aggregate proportion to calculate the testing disparity
