
FIGURE 2.
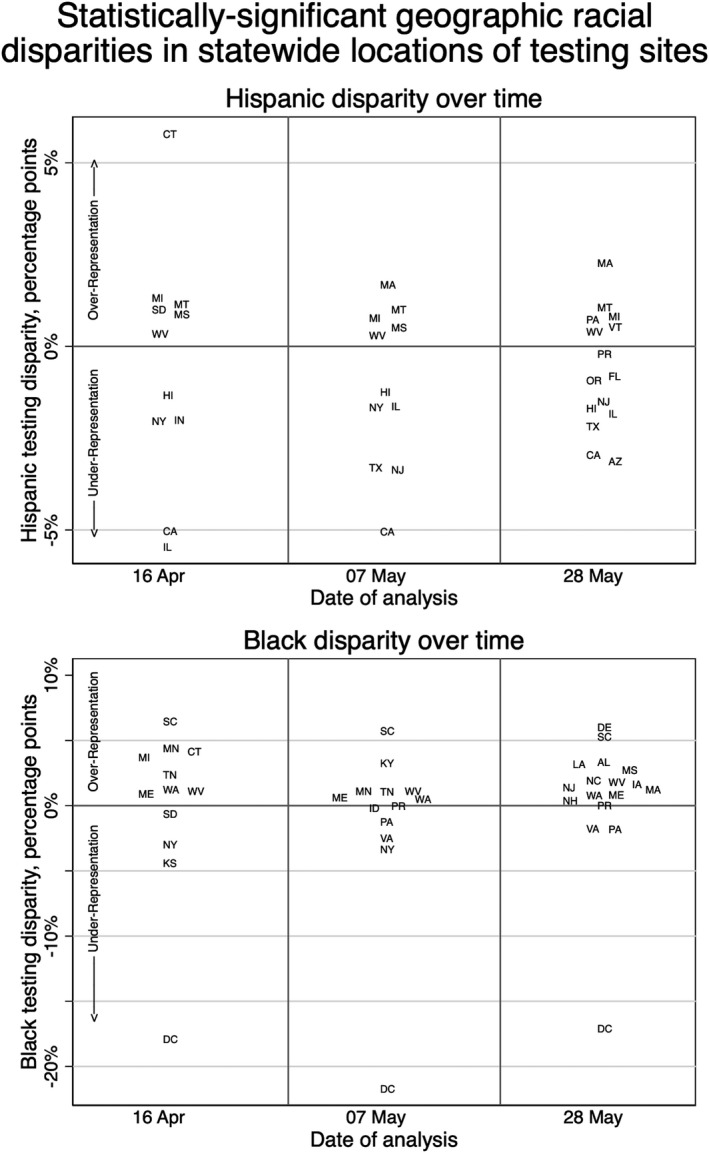
Statistically significant statewide racial and ethnic disparities in testing geography. For both Hispanic and non‐Hispanic Black, states with significant disparities (p‐value <.05) are distributed along the y‐axis based on the percentage point disparity between the per cent makeup of the zip codes containing testing sites and per cent makeup of surrounding counties. Positive (negative) testing disparities indicate that the racial/ethnic group is overrepresented (underrepresented) in the zip codes with testing compared to the surrounding counties. Horizontal separation is only to make state abbreviations legible and does not convey meaning