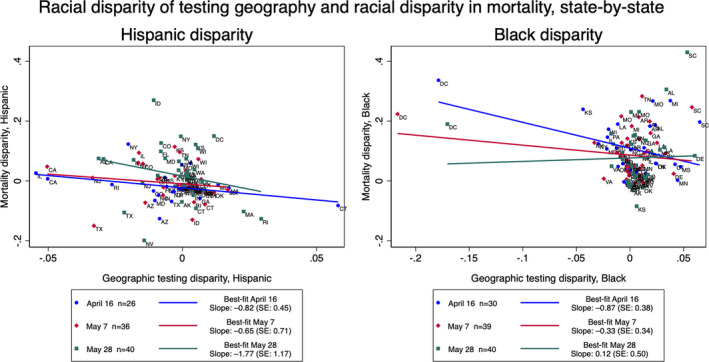
FIGURE 3.

Disparity of testing geography and disparity in mortality, state‐by‐state. For Hispanic and non‐Hispanic Black and all dates of analysis, statewide disparities in the makeup of zip codes and what would be expected from random distribution are plotted against the statewide disparity in mortality, comparing the group's proportion of total state population to its proportion of COVID‐19 deaths 1 to 3 weeks later with known race/ethnicity. Positive (negative) testing disparities indicate that the racial/ethnic group is overrepresented (underrepresented) in the zip codes with testing compared with the surrounding counties. Positive (negative) mortality disparities indicate that members of the racial/ethnic group are overrepresented (underrepresented) among deaths compared to what would be expected given the proportion of the racial/ethnic group in the state. Best‐fit lines show simple linear regression between the two disparities for each date of analysis. A version of this figure without DC and CT, the two notable outliers, is available in the supplement (Supplemental Figure 2)
