Figure 1.
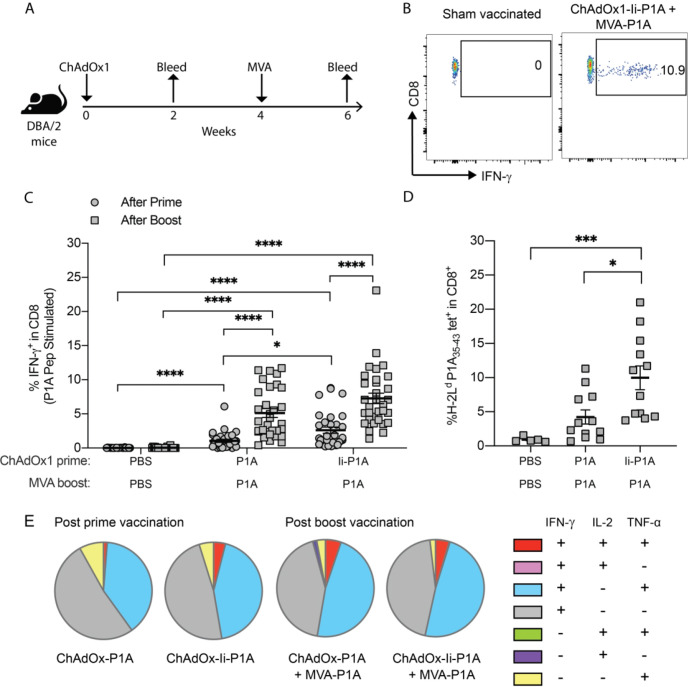
ChAdOx1/MVA P1A vaccination induces robust P1A-specific CD8+ T-cell responses. DBA/2 mice received a prime vaccination via intramuscular (i.m.) injection with 108 IU of ChAdOx1-P1A ± Ii or a sham vaccination with PBS then 4 weeks later received a boost vaccination with 107 PFU of MVA-P1A. Mice were bled 10-20 days after vaccination with ChAdOx1 and 9-14 days after vaccination with MVA. (A) Experimental scheme. (B) PBMCs were stimulated ex vivo with 4 µg/ml of P1A peptide pools and the percentage of cytokine-producing P1A-specific CD8+ T cells in the blood after each vaccination was then determined by intracellular cytokine staining (ICS) and flow cytometry. The representative dot plots show gating of IFN-γ+ CD8+ T cells. (C, D) Percentages of IFN- γ+ cells among CD8+ T cells after prime (closed circles) and boost (closed squares) are shown in (C) and percentages of P1A35-43 tetramer+ CD8+ T cells after boost are shown in (D). Data are shown as mean ± SEM, each symbol represents an individual mouse with 5-10 mice per group, pooled from 2-4 independent experiments. Statistically significant differences between groups were determined by a Kruskal-Wallis test with Dunn’s multiple comparisons test. *, p ≤ 0.05, ***, p ≤ 0.001 ****, p ≤ 0.0001. (E) Cytokine production profile of P1A-specific CD8+ T cells is shown. A Boolean analysis was performed in FlowJo software to calculate the percentage of CD8+ T cells producing only one, a combination of two, or all three of IFN-γ, IL-2 and TNF-α. Pie charts show the mean relative proportion of each cytokine producing subset out of the total antigen-specific CD8+ T cells.

