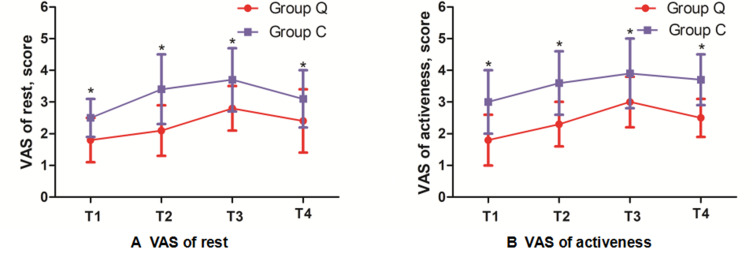
Figure 2.
Comparison of postoperative pain scores in the two groups. The VAS scores of rest pain (A) and active pain (B) in the both groups at 0 h (T1), 12 h (T2), 24 h (T3) and 48 h (T4) after surgery. Data represent the mean ± SD, compared with Group C, *P<0.01. Data were compared by Mann–Whitney U-test.
Abbreviation: VAS, visual analog scores.

