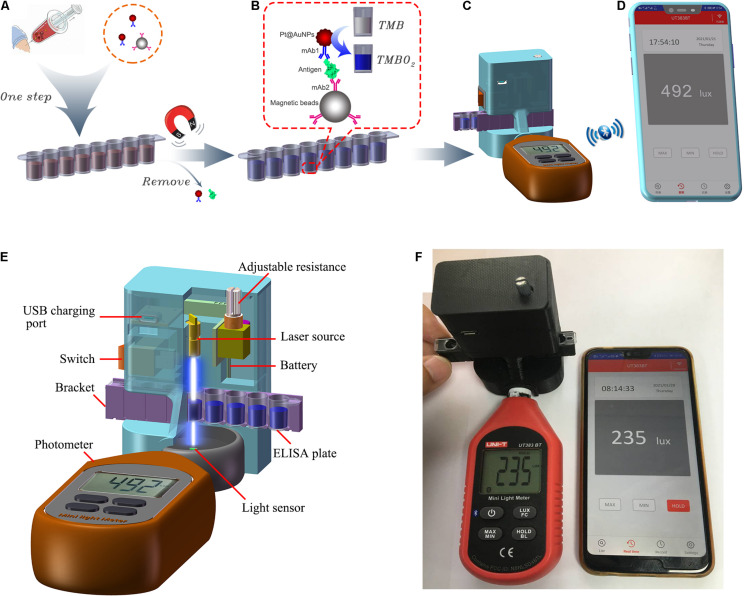
FIGURE 1.
The schematic diagram of SP-NLISA. (A) The serum sample (1:1 diluted with sample buffer) was aliquoted into the freeze-dried microwells and mixed for 40 min at 37°C. (B) The magnets were used to capture the complexes after washing and the substrate solution (50% TMB + 50% H2O2) was catalyzed by Pt@AuNPs in the complexes for 10 min at 37°C. (C) The microwells were located in the smartphone-based device and (D) the results were shown using the iENV app. (E) The main structure of the smartphone-based device for NLISA and (F) its connection with the app (iENV) in the smartphone via Bluetooth.

