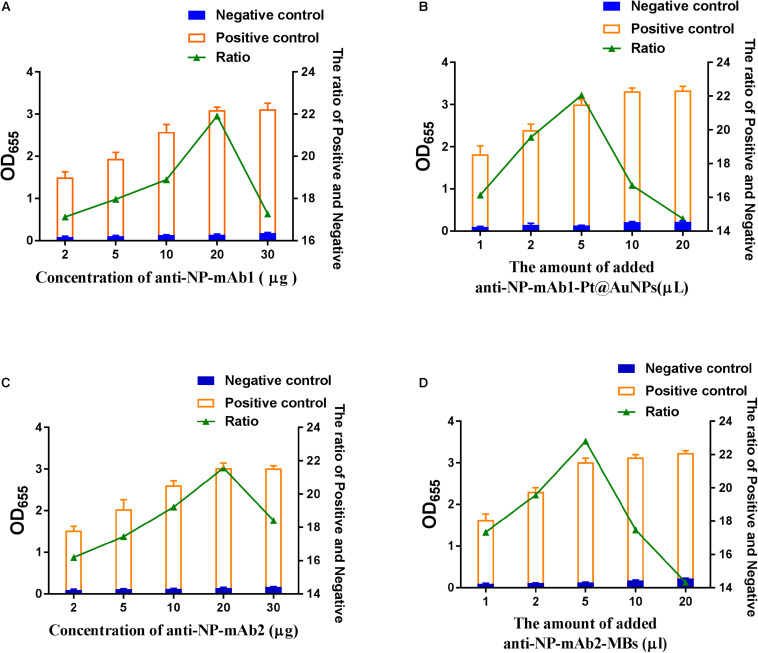
FIGURE 3.
The optimization of SP-NLISA. (A) The amounts of monoclonal antibodies (mAb1) labeled Pt@AuNPs were optimized. (B) The amounts of the mAb1-Pt@AuNPs were optimized. (C) The amounts of monoclonal antibodies (mAbs) labeled MBs were optimized. (D) The amounts of mAb2-MBs were optimized. A sample from a healthy blood donor was used as the negative control, and the addition of 1 μg/mL NP standard in the negative control sample was used as the positive control.

