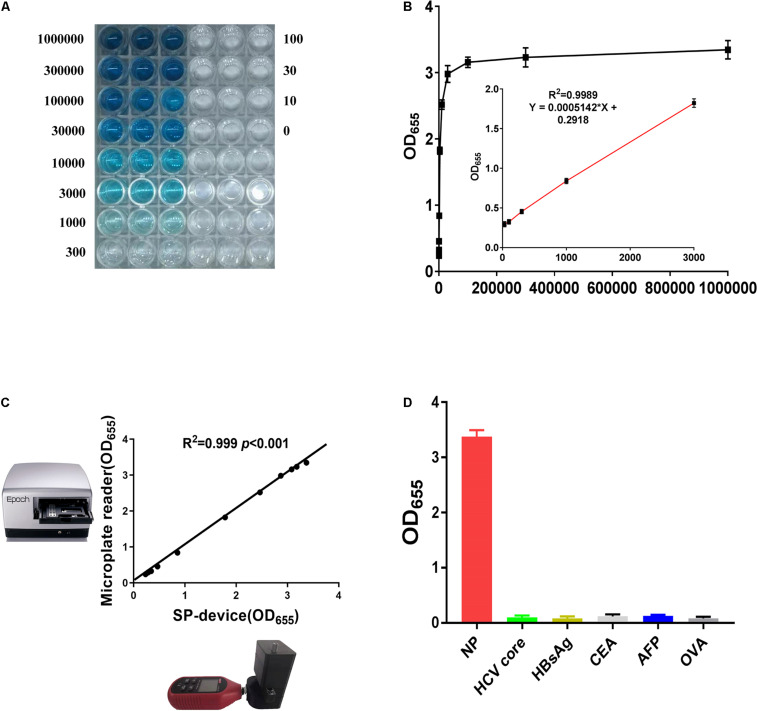
FIGURE 4.
The sensitivity and specificity of SP-NLISA. (A,B) The standard curve and linear range of SP-NLICA for NP detection. (C) The results tested by SP-device and commercial microplate reader exhibited an excellent correlation and no significant difference (R2 = 0.999, P < 0.001). (D) The specificity of SP-NLISA for NP detection. The added protein concentration was 1 μg/mL.

