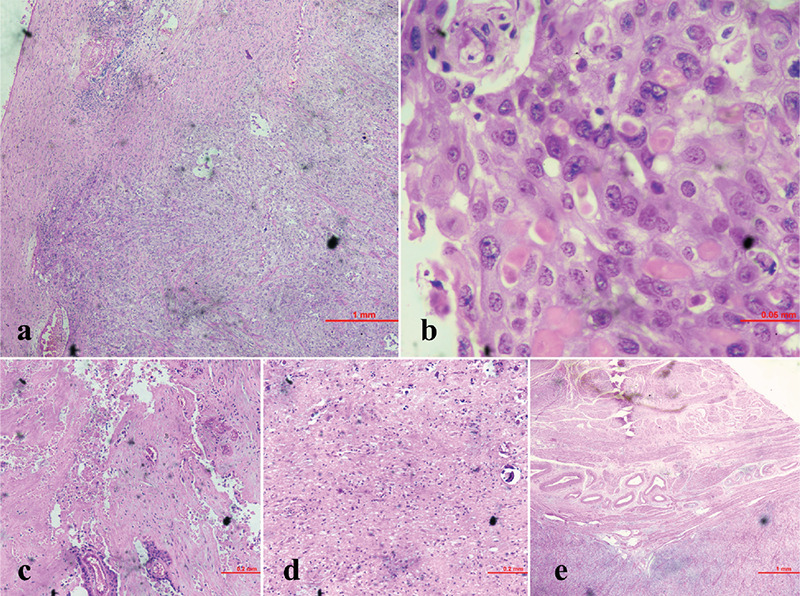
Figure 3.

Histopathological images; a) 40x haemotoxylin & eosin (H&E) stain, showing squamous cell differentiation; b) 40x H&E stain, showing squamous cells with individual cell keratinization; c) H&E stain, showing necrotic areas; d) H&E stain, showing glial tissue (neuroectoderm) with calcification; e) H&E stain, showing myometrial involvement
