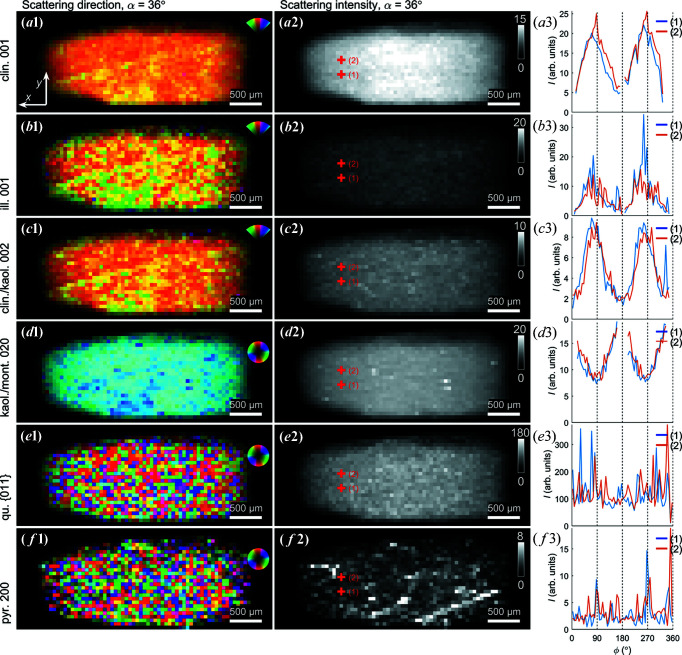
Figure 3.
Orientation, intensity and orientation distribution of selected Bragg diffraction peaks, observed for the projection angle α = 36°. Note the band-like orientation feature stretching diagonally across the sample. (a1) Dominant scattering direction for the clinochlore 001 Bragg peak, colour coded as shown in the inset. (a2) Azimuthally integrated intensity of the clinochlore Bragg peak. (a3) Azimuthal intensity variations for two points indicated in (a2). (b)–(f) Similarly for the illite 001, clinochlore 002/kaolinite 002, kaolinite 020/montmorillonite 020, quartz {011} (overlapping with clinochlore and illite) and pyrite {200} Bragg peaks, respectively.

