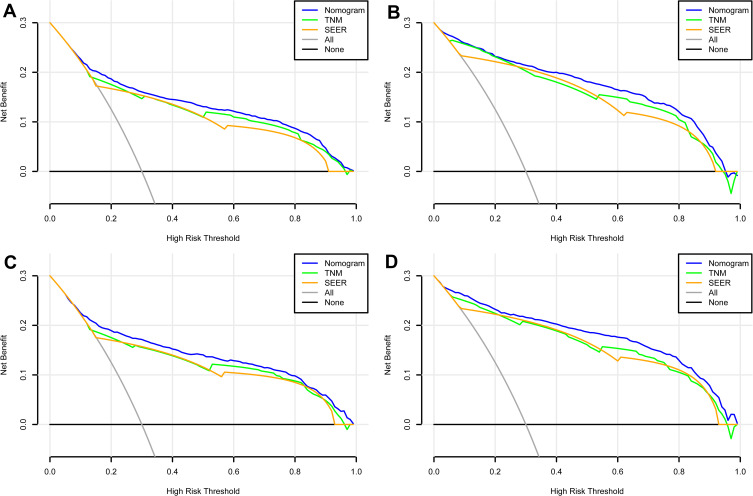
Figure 6.
DCA curves of the nomograms for OS and CSS in both training and validation sets. (A) The DCA curve of nomogram for OS in training set; (B) the DCA curve of nomogram for CSS in training set; (C) the DCA curve of nomogram for OS in validation set; (D) the DCA curve of nomogram for CSS in validation set.
Abbreviations: DCA, decision curve analysis; OS, overall survival; CSS, cancer-specific survival.

