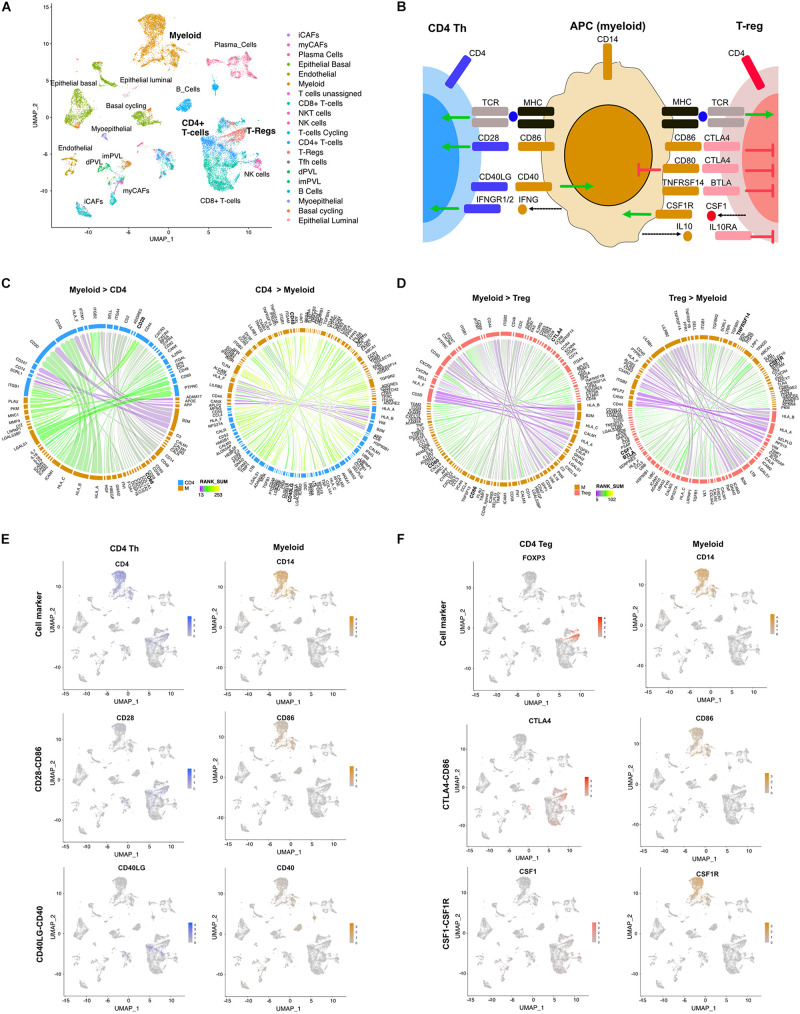
FIGURE 2.
Differential LR interactions between myeloid cells and either Th or Treg cells. (A) UMAP plot shows distinct cell populations in five TNBC tumors. (B) Image shows known interactions identified by LR hunting between myeloid antigen presenting cells and either CD4 Th or Tregs. Colored arrows indicate direction of signaling from ligand to receptor for stimulatory (green) and inhibitory (red) events. Dashed arrows indicated secreted ligands. Circos plots show the top interactions and by direction for (C) myeloid and CD4 T cells and (D) myeloid and Treg cells. LR interactions are colored by interaction strength (rank sum) and line thickness represents the frequency of interaction across the five tumors. (E) UMAP plots show expression of CD4 Th and myeloid cell markers and expression of LR interactions for CD28-CD86 and CD40L-CD40. (F) UMAP plots show expression of Treg and myeloid cell markers and expression of LR interactions for CTLA4-CD86 and CSF1-CSF1R.

