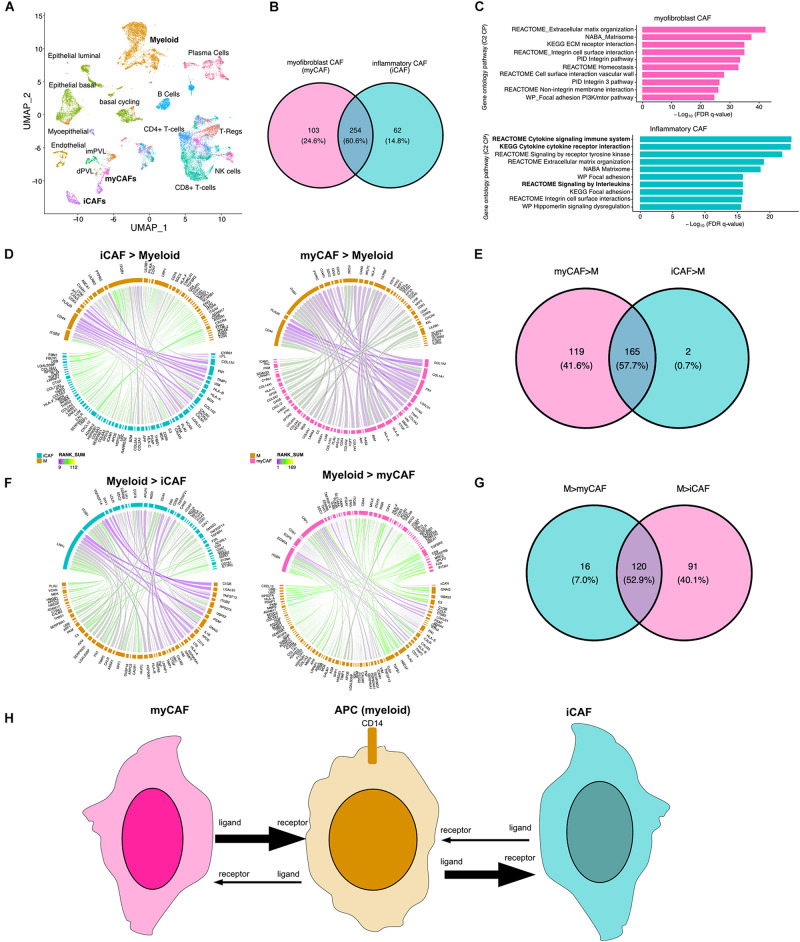
FIGURE 4.
Direction of LR interactions favor myofibroblast CAFs to myeloid and myeloid to inflammatory CAFs. (A) UMAP plot shows distinct cell populations in five TNBC tumors with cells of interest in bold. (B) Venn diagram of interactions between myeloid and myCAF with interaction between myeloid and iCAF. (C) Gene ontology pathway analysis (C2 canonical pathways) of differential interactions unique to myCAFs (pink) or iCAFs (blue). (D) Circos plots show the top interactions between iCAF and myeloid cells (iCAF > myeloid) or myCAF to myeloid (myCAF > myeloid). (E) Venn diagram shows overlap of interactions between CAFs and myeloid cells. (F) Circos plots show the top interactions between myeloid cells and iCAFs (iCAF > myeloid) or myCAFs (myCAF > myeloid). (G) Venn diagram shows overlap of interactions between myeloid to CAF interactions. (H) Summary of directional interactions between myeloid cells and myCAFs or iCAFs.

