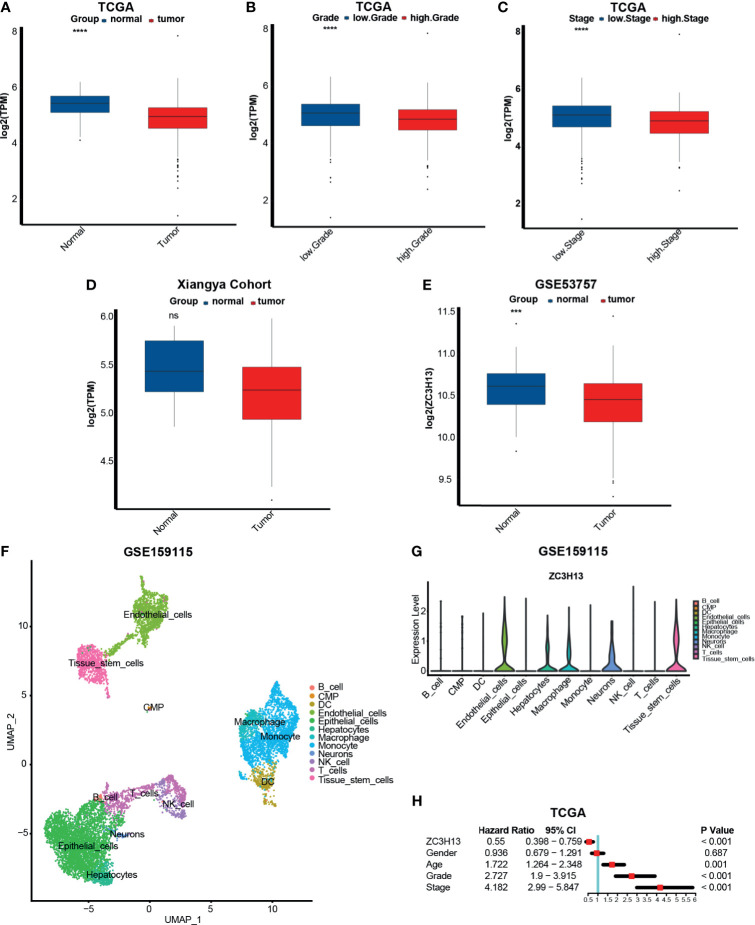
Figure 1.
The relationship between ZC3H13 and clinicopathological and prognostic characteristics in KIRC. (A) The histogram of log2(TPM) of ZC3H13 between normal and cancer tissues based on TCGA database. Normal tissue, blue; Cancer tissue, red. (T test, ****P < 0.0001). (B) The histogram of log2(TPM) of ZC3H13 between low and high grade based on TCGA database. Low grade, blue; High grade, red. (T test, ****P < 0.0001).. (C) The histogram of log2(TPM) of ZC3H13 between low and high stages based on TCGA database. Low stage, blue; High stage, red. (T test, ****P < 0.0001). (D) The histogram of log2(TPM) of ZC3H13 between normal and cancer tissues in Xiangya cohort. Normal tissue, blue; Cancer tissue, red. (T test, ns, not statistically significant). (E) The histogram of log2(ZC3H13) between normal and cancer tissues based on GSE53757. Normal tissue, blue; Cancer tissue, red. (T test, ****P < 0.0001). (F) Single-cell atlas of KIRC adjacent normal tissues. UMAP plot of 6046 cells obtained from GSE159115, which was visualized and annotated using “Seurat” and “Single” R package respectively. CMP, common myeloid progenitor; DC, dendritic cell. (G) Violin plot of ZC3H13 expression pattern between different cell types in KIRC adjacent normal tissues. (H) Forest figure of single factor Cox analysis on sex, age, ZC3H13 expression, grade and stage. Calculated using Cox proportional hazard model and visualized using “forestplot” R package.

