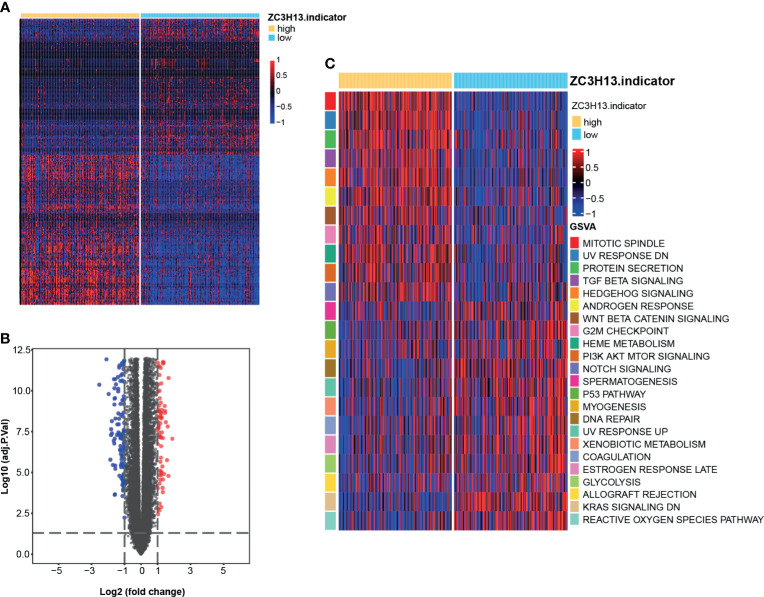
Figure 2.
DEGs between the high and low ZC3H13 groups and functional analyses of DEGs. (A) Heatmap drawn based on the 271 DEGs between the high and low ZC3H13 groups. Lowly expressed DEGs, blue; Highly expressed DEGs, red. (“limma” R package, adjusted P value < 0.05 and |logFC| > 1 were set as the significance criteria for significant DEGs). (B) Volcano plot drawn based on the DEGs between the high and low ZC3H13 groups. Log2(FC) < -1, blue; Log2(FC) > 1, red; (“limma” R package, adjusted P value < 0.05 and |logFC| > 1 were set as the significance criteria for significant DEGs). (C) Heatmap drawn based on the GSVA analysis of biological pathways between the high and low ZC3H13 groups. Inhibition pathways, blue; Activation pathways, red.

