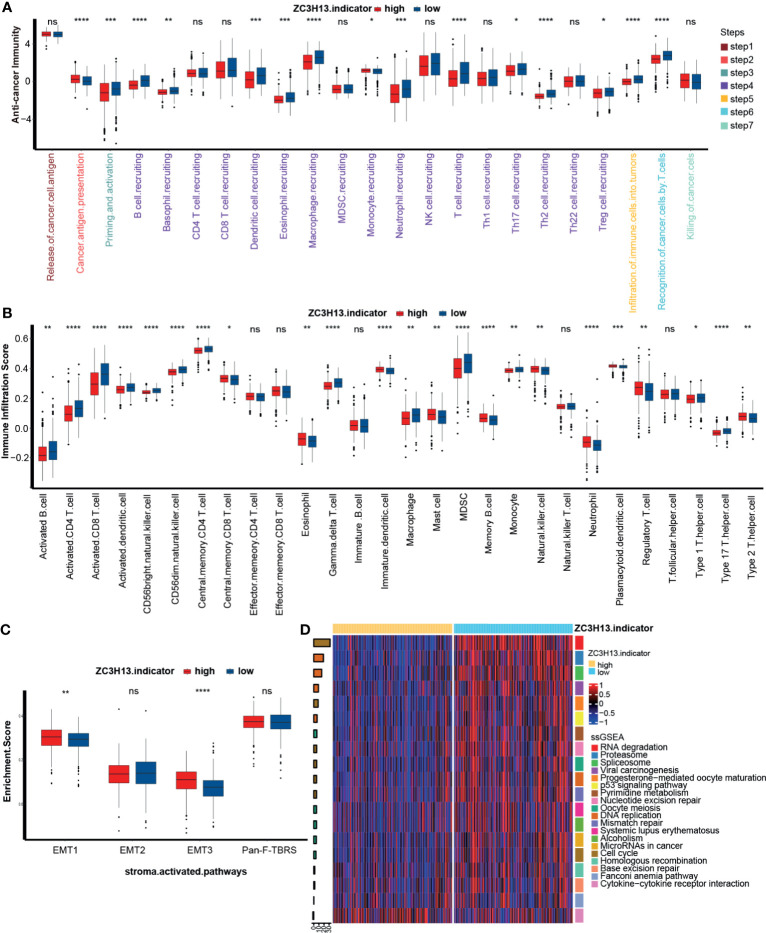
Figure 3.
Different immunological characteristics between the high and low ZC3H13 groups (A) Activation of cancer immunity cycles between the high and low ZC3H13 groups; Low ZC3H13 group, blue; High ZC3H13 group, red. MDSC, myeloid-derived suppressor cell; NK, natural killer cell; Th, helper T cell; Treg, regulatory T cell. (T test, *P < 0.05; **P < 0.01; ***P < 0.001; ****P < 0.0001; ns, not statistically significant). (B) The scores of immune cell infiltration in the TME between the high and low ZC3H13 groups; Low ZC3H13 group, blue; High ZC3H13 group, red; MDSC, myeloid-derived suppressor cell. (T test, *P < 0.05; **P < 0.01; ***P < 0.001; ****P < 0.0001; ns, not statistically significant). (C) Activation of stroma-activated pathways between the high and low ZC3H13 groups; Low ZC3H13 group, blue; High ZC3H13 group, red; EMT, epithelial–mesenchymal transition; Pan-F-TBRS, panfibroblast TGF-b response signature. (GSVA analysis and T test, *P < 0.05; **P < 0.01; ***P < 0.001; ****P < 0.0001; ns, not statistically significant). (D) Heatmap based on different immunotherapy predicted pathways between the high and low ZC3H13 groups. The bar plots on the left represent log10 p-values; positive values, activation; negative values, inhibition; the bar plots on the right represent different pathways.

