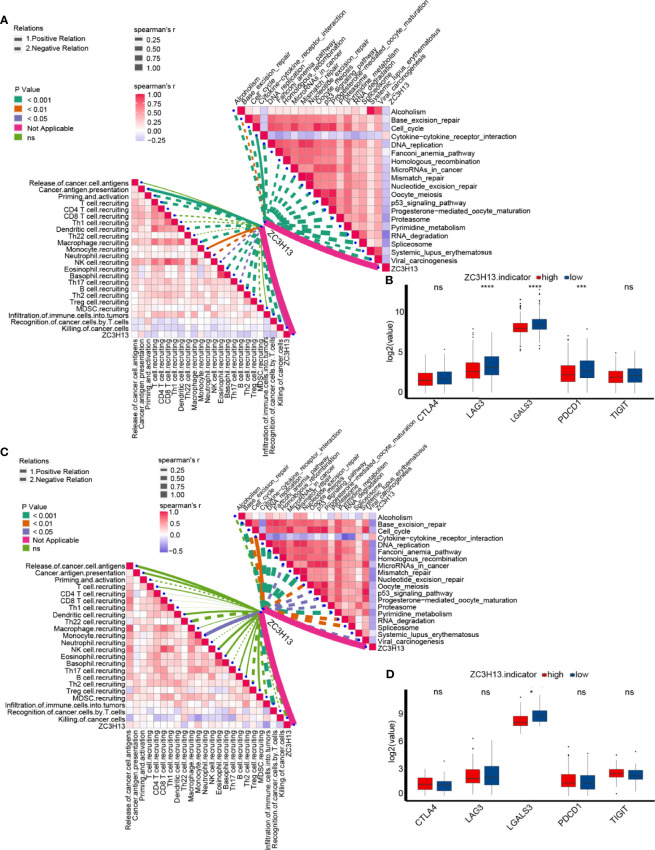
Figure 4.
The linear relationship between the expression of ZC3H13 and the enrichment scores of immune cycles and ICB efficacy prediction pathways. (A) Spearman correlation of ZC3H13 expression with cancer immunity and immune related pathways, presented on the left and right respectively. The different types of lines represent positive or negative correlations; the thickness of the lines and the color of the bar plots represent the strength of correlation; and the different colors of the lines represent p-values. MDSC, myeloid-derived suppressor cell; NK, natural killer cell; Th, helper T cell; Treg, regulatory T cell. (B) The histogram of log2(TPM) values of immune checkpoint genes between different ZC3H13 groups. Low ZC3H13 group, blue; High ZC3H13 group, red. (T test, ***P < 0.001; ****P < 0.0001; ns, not statistically significant). (C) Spearman correlation of ZC3H13 expression with cancer immunity and immune related pathways in our own RNA-seq cohort, presented on the left and right respectively. The different types of lines represent positive or negative correlations; the thickness of the lines and the color of the bar plots represent the strength of correlation; and the different colors of the lines represent p-values. MDSC, myeloid-derived suppressor cell; NK, natural killer cell; Th, helper T cell; Treg, regulatory T cell. (D) The histogram of log2(TPM) values of immune checkpoint genes between different ZC3H13 groups in our own RNA-seq cohort. Low ZC3H13 group, blue; High ZC3H13 group, red. (T test, *P < 0.05; ns, not statistically significant).

