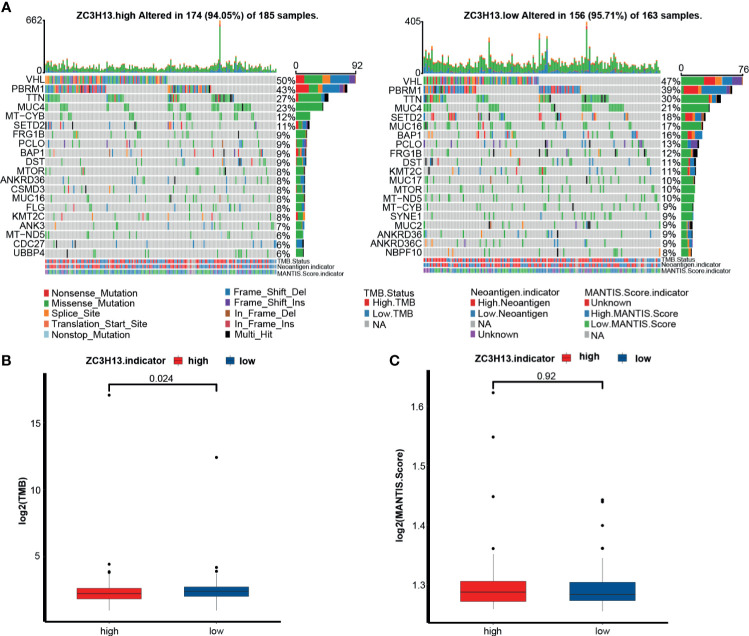
Figure 5.
The relationship between ZC3H13 and the tumor mutation spectrum, TMB and MSI in KIRC. (A) Mutation spectrum of the high (left) and low (right) ZC3H13 groups in KIRC. Different colors represented different mutation types annotated at the bottom; The barplot on the top represented mutation burden. The numbers on the right represented mutation frequency. TMB, tumor mutation burden. MANTIS, microsatellite analysis for normal-tumor instability. (B) The histogram of log2(value) of TMB between the different ZC3H13 groups. Low ZC3H13 group, blue; High ZC3H13 group, red. (T test). (C) The histogram of log2(value) of MANTIS score between the different ZC3H13 groups. Low ZC3H13 group, blue; High ZC3H13 group, red. (T test).

