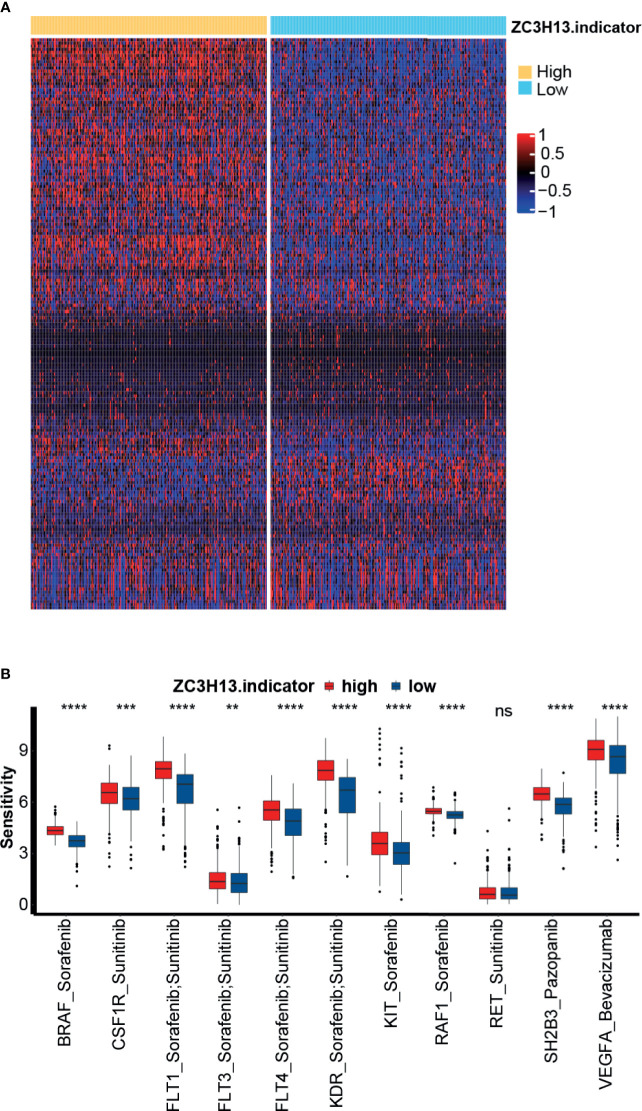
Figure 6.
The relationship between ZC3H13 and the sensitivity to targeted therapy of KIRC. (A) Heatmap drawn based on the different sensitivities to the 183 drugs selected from the DrugBank database. (B) The histogram of sensitivities to the selected targeted therapy between the different ZC3H13 groups. Low ZC3H13 group, blue; High ZC3H13 group, red. (T test, **P < 0.01; ***P < 0.001; ****P < 0.0001; ns, not statistically significant).

