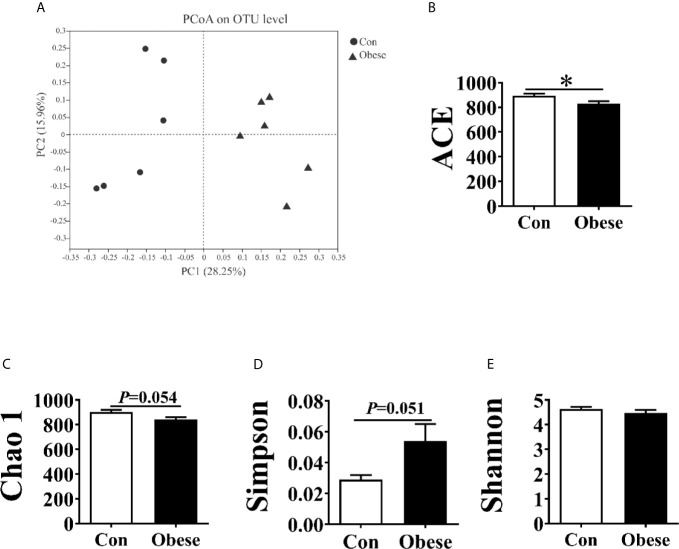
Figure 6.
Alpha and beta diversities for the fecal microbiota community. (A) Principal coordinates analysis (PCoA, Bray–Curtis distance) plot of the fecal microbial community structure. (B–E). The microbiota α diversity was estimated by ACE, Chao 1, Simpson, and Shannon index. “*” indicates statistically significant differences (P < 0.05).

