Abstract
The aim of this study was to identify a novel cancer stemness-related ceRNA regulatory axis in lung adenocarcinoma (LUAD) via weighted gene coexpression network analysis of a stemness index. The RNA sequencing expression profiles of 513 cancer samples and 60 normal samples were obtained from the TCGA database. Differentially expressed mRNAs (DEmRNAs), lncRNAs (DElncRNAs), and miRNAs (DEmiRNAs) were identified with R software. Functional enrichment analysis was conducted using DAVID 6.8. The ceRNA network was constructed via multiple bioinformatics analyses, and the correlations between possible ceRNAs and prognosis were analyzed using Kaplan–Meier plots. WGCNA was then applied to distinguish key genes related to the mRNA expression-based stemness index (mRNAsi) in LUAD. After combining the weighted gene coexpression and ceRNA networks, a novel ceRNA regulatory axis was identified, and its biological functions were explored in vitro and vivo. In total, 1,825 DElncRNAs, 291 DEmiRNAs, and 3,742 DEmRNAs were identified. Functional enrichment analysis revealed that the DEmRNAs might be associated with LUAD onset and progression. The ceRNA network was constructed with 14 lncRNAs, 10 miRNAs, and 52 mRNAs. Kaplan–Meier analysis identified 2 DEmiRNAs, 5 DElncRNAs, and 41 DEmRNAs with remarkable prognostic power. One gene (MFAP4) in the ceRNA network was found to be closely related to mRNAsi by using WGCNA. Functional investigation further confirmed that the C8orf34-as1/miR-671-5p/MFAP4 regulatory axis has important functions in LUAD cell migration and stemness. This study provides a deeper understanding of the lncRNA–miRNA–mRNA ceRNA network and, more importantly, reveals a novel ceRNA regulatory axis, which may provide new insights into novel molecular therapeutic targets for inhibiting LUAD stem characteristics.
Key words: ceRNA network, Weighted gene correlation network analysis (WGCNA), Stemness index, Lung adenocarcinoma (LUAD)
INTRODUCTION
Lung adenocarcinoma (LUAD) is one of the most common subtypes of non-small cell lung cancer, accounting for 40% of all adult lung cancer cases, and it preferentially occurs in women and nonsmokers1. Despite ongoing efforts in multimodal approaches, the long-term prognosis of LUAD is still undesirable, and an increasing number of new patients are diagnosed at advanced stages, even with single or multiple distant metastases. Effective prophylaxis and early diagnosis can lead to a significantly increased postoperative curable rate. Therefore, an in-depth elucidation of the molecular mechanisms contributing to LUAD genesis and progression is helpful and is especially imperative for LUAD treatment.
The development and progression of tumors are complex multistep processes involving numerous gene regulatory networks. First proposed in 2011, the competing endogenous RNA (ceRNA) hypothesis suggests that all RNA transcripts can participate in regulating each other through the competitive binding of miRNA response elements (MREs), revealing a novel regulatory mechanism referring to the interactions between coding and noncoding RNAs2. Increasing evidence has confirmed that complex ceRNA cross talk exists in the transcriptional regulation of many diseases, particularly in cancer3,4. Long noncoding RNAs (lncRNAs) act as the main regulatory factors affecting many targeted genes through competitive microRNA (miRNA) binding, and the complex cross talk among mRNAs, miRNAs, and lncRNAs probably has a crucial influence on the progression and prognosis of LUAD, but information on this is currently largely unknown.
Bioinformatics approach-based disease risk model analysis has become a significant and routine strategy for cancer diagnosis and treatment. Weighted gene correlation network analysis (WGCNA) is a powerful approach for constructing a scale-free topology, and based on large-scale data sets, it could also be used to identify coexpression modules that comprise highly correlated hub genes or noncoding RNAs5. By using WGCNA, the correlations between these modules and clinical features can be systematically assessed to find candidate biomarkers or therapeutic targets. As a powerful analysis tool, it has been widely employed in multiple malignancies, such as hepatocellular carcinoma6 and uveal melanoma7. Compared with differential expression analysis, WGCNA uses the information of thousands or nearly 10,000 genes or all gene profiles to identify the gene sets of interest and analyzes the significant associations between these gene sets and phenotypes, thus eliminating the problem of multiple hypothesis test correction.
With the development of advanced sequencing technologies, tumor heterogeneity has become gradually understood, and it has been revealed that solid tumors may comprise various cell subpopulations with distinct genomic alterations in the same tumor, one type of which is cancer stem-like cells (CSCs)8. Previous studies have found that CSCs are enriched in lung cancer tissues9,10. Lung cancer stem-like cells (LCSCs) are a small subset of cells that possess self-renewal and multidirectional differentiation potential, high tumorigenicity, and strong drug resistance. Because of these biological characteristics, LCSCs often appear to be enriched in residual cancer tissues after clinical radiotherapy and chemotherapy11. These residual LCSCs are considered to be responsible for recurrence and metastasis12. Although LCSCs have been continuously studied worldwide, an integrated understanding of lung cancer stemness, including the key factors or vital pathways involved in LCSCs, is lacking. To solve these issues, Malta et al. proposed a one-class logistic regression (OCLR) machine learning algorithm to quantify stemness from normal cell types with various degrees of stemness13. The innovative application of the OCLR algorithm in multiplatform analyses involving transcriptomes and methylomes produces two stemness indexes: the mRNA expression-based stemness index (mRNAsi) and the DNA methylation-based stemness index (mDNAsi). Higher mRNAsi scores were associated with biological processes active in CSCs and greater tumor dedifferentiation. A recent study by Zhang et al. reported that the mRNAsi index is significantly associated with LUAD14. In the latest study, Zhao et al. identified several novel cancer stem cell-related biomarkers in LUAD by stemness index15. By using these stemness indexes, the researchers further analyzed cancer stemness in nearly 12,000 samples of 33 tumor types from The Cancer Genome Atlas (TCGA) database13,16. Hence, we can obtain the mRNAsi scores of each TCGA-LUAD sample in the above study.
In the present study, by taking advantage of both the TCGA-LUAD cohort and the mRNAsi index, we identified a novel ceRNA regulatory axis associated with LUAD stemness by combining the ceRNA network and WGCNA in TCGA. Our study established an innovative research strategy for identifying stemness-related genes and predicting their roles in cancer.
METHODS AND MATERIALS
Data Source and Preprocessing
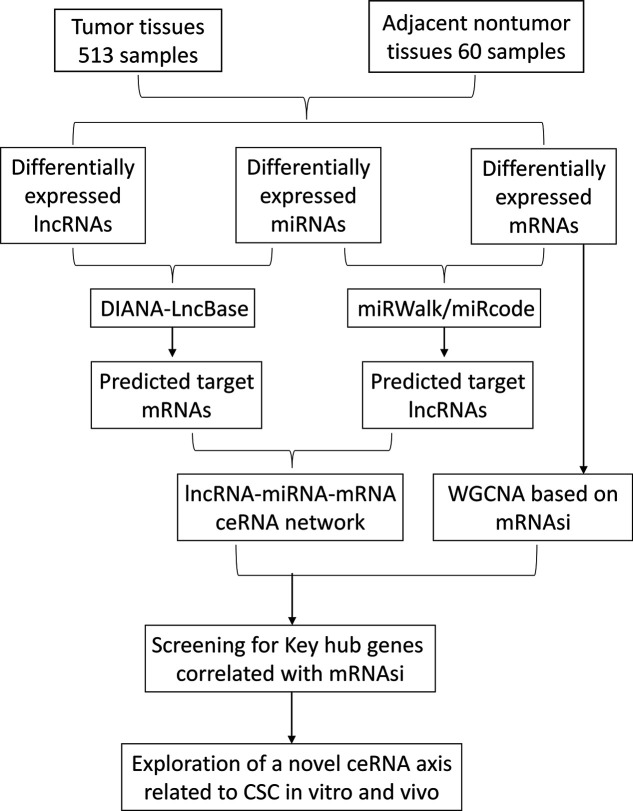
The expression profiles of mRNAs and lncRNAs from 573 samples (513 cancer samples and 60 normal samples) and miRNA transcription data of 559 samples (513 cancer samples and 46 normal samples) were retrieved from TCGA database. Additionally, their corresponding clinicopathological information (age, sex, tumor stage, overall survival data, and pathologic TNM stage data) were also obtained from TCGA, which was conducted in accordance with the guidelines of TCGA (http://cancergenome.nih.gov/publications/publicationguidelines) (Table 1). The Entrez gene IDs of all RNAs from the original expression profiles were annotated by the Ensembl database (http://www.ensembl.org/index.html, version 89). No additional ethical approval or informed consent was required in our study since all raw data came from public TCGA data, as detailed in a later section. The flowchart below shows the framework used in this study (Fig. 1).
Table 1.
Clinical Features of the Patients With Lung Adenocarcinoma (LUAD) From TCGA
| Characteristics | Patients (n = 513) |
|---|---|
| Age (years) | |
| ≤60 | 157 (30.60%) |
| >60 | 337 (65.69%) |
| Unknown | 19 (3.71%) |
| Gender | |
| Male | 237 (46.1%) |
| Female | 276 (53.9%) |
| Tumor stage | |
| Stage I | 274 (53.41%) |
| Stage II | 121 (23.59%) |
| Stage III | 84 (16.37%) |
| Stage IV | 26 (5.07%) |
| Unknown | 8 (1.56%) |
| TNM staging system | |
| T1 | 168 (32.75%) |
| T2 | 276 (53.80%) |
| T3 | 47 (9.16%) |
| T4 | 19 (3.70) |
| TX | 3 (0.59%) |
| TNM staging system | |
| N0 | 330 (64.33%) |
| N1–3 | 171 (33.33%) |
| NX | 11 (2.14%) |
| Unknown | 1 (0.20%) |
| TNM staging system | |
| M0 | 344 (67.06%) |
| M1 | 25 (4.87%) |
| MX | 144 (27.07%) |
| Unknown | 4 (0.78%) |
| Survival state | |
| Live | 321 (62.57%) |
| Dead | 183 (35.67%) |
| Unknown | 9 (1.75%) |
Figure 1.
Flowchart of competing endogenous RNA (ceRNA) network construction and weighted gene correlation network analysis (WGCNA).
Differential Analysis of RNA Profiles
To improve the reliability of the analyzed data, the fragments per kilobase per million mapped fragments (FPKM) values of all raw data were first normalized to transcript per million reads (TPM) for further analysis. In addition, to avoid low abundance impact on the next procedure, RNAs with an average value of <1 were excluded. The differential expression of RNAs between LUAD and normal tissues was analyzed by using the “Limma” package in R software17. Differentially expressed RNAs were considered statistically significant based on thresholds of |log2-fold change (FC)| > 1 and a cutoff false discovery rate (FDR) adjusted p < 0.01. Finally, to visualize the differential expression profiles of the enrolled RNAs, we used the “gplots” and “pheatmap” packages in R software to draw volcano maps and heat maps, respectively.
Functional Enrichment Analysis
To further assess the potential mechanistic functions of the differentially expressed mRNAs, we conducted Gene Ontology (GO) and Kyoto Encyclopedia of Genes and Genomes (KEGG) analyses in the Database for the Annotation, Visualization and Integrated Discovery (DAVID, Version 6.8, https://david.ncifcrf.gov). In addition, Cytoscape 3.6.1 was used to generate a visual graphic presentation of the interaction of the enriched clusters from the GO and KEGG pathway analyses.
Construction of the ceRNA Network and Survival Analysis
An lncRNA-mediated ceRNA network in LUAD was constructed based on the ceRNA theory that ceRNAs can act as sponges to bind miRNAs competitively, affecting the activity of downstream mRNAs. We built the ceRNA regulatory network in subsequent steps as follows. First, the target mRNAs of the differentially expressed miRNAs (DEmiRNAs) were predicted by miRWalk (http://mirwalk.umm.uni-heidelberg.de) and miRcode. Next, DIANA-LncBase (http://www.microrna.gr/LncBase) was used to predict the lncRNA–miRNA interactions, and we obtained the intersections of the target mRNAs and differentially expressed RNAs (DEmRNAs). Meanwhile, the target lncRNAs were intersected with the differentially expressed lncRNAs (DElncRNAs). The correlations between the intersecting DElncRNAs, DEmiRNAs, and DEmRNAs were calculated by Pearson correlation to predict a ceRNA network, which was visualized by using Cytoscape (version 3.6.1) software. Kaplan–Meier survival curves were constructed to assess the prognostic value of the DEmRNAs, DElncRNAs, and DEmiRNAs involved in the ceRNA network by using KM plotter (https://kmplot.com/analysis/index.php?p=service&cancer=lung)18 and starBase v3.0 (http://starbase.sysu.edu.cn)19. Using the median expression value of the differentially expressed RNAs as the cutoff value, the LUAD patients were divided into two groups (high expression group and low expression group) for the overall survival analysis. The log-rank test was used to compare survival differences between the high- and low-risk groups.
WGCNA
WGCNA is a systematic biological method that uses gene expression data to construct scale-free networks, and in this study, it was used to analyze the intramodular connectivity and gene significance in LUAD. We first obtained expression spectrum data and phenotypic data by removing the outlier samples and then constructed a coexpression similarity matrix. Next, the gene coexpression similarity matrix was transformed into an adjacency matrix by choosing an appropriate soft-thresholding power β value. The adjacency matrix was then converted to a topological matrix by using the topological overlap measure (TOM), which used to describe the degree of association between genes. Finally, a TOM-based dissimilarity measure (1-TOM) was used as input to carry out hierarchical clustering for all DEmRNAs, and then a dynamic tree-cutting algorithm was used to identify modules. Moreover, gene significance (GS) was calculated to quantify associations of individual genes with sample clinical traits, and module membership (MM) was defined as the correlation between gene expression values and the module eigengene (ME). A heat map was drawn to analyze and visualize the relationship of each module.
Cell Culture, Vector Construction, and Transfection
Human LUAD cell lines (A549 and H1299) and human embryonic kidney (HEK) 293T cells were obtained from the China Center for Type Culture Collection (CCTCC; Wuhan, China). All cells were cultured in Dulbecco’s modified Eagle’s medium (DMEM) or RPMI-1640 supplemented with 10% fetal bovine serum (FBS) and penicillin/streptomycin (100 U/ml). C8orf34-as1-specific siRNA (si-C8orf34-as1 targeting sequence: 5′-TTCCATTGTACATATATACTACA-3′) and hsa-miR-671-5p mimics/inhibitors were designed and synthesized by RiboBio Co. Ltd. (Guangzhou, China). Human MFAP4 cDNA was amplified by polymerase chain reaction (PCR) and cloned into the pHBLV lentiviral vector to generate the pHBLV-Flag-MFAP4 recombinant plasmid. Transfections were performed using a Lipofectamine 3000 kit (Invitrogen; Thermo Fisher Scientific Inc., Carlsbad, CA, USA) according to the manufacturer’s protocol.
Real-Time Quantitative PCR (RT-qPCR)
Total RNA from cells was extracted by TRIzol reagent (Invitrogen). Then cDNA was synthesized with a TaqMan real-time PCR kit. RT-PCR was performed using a SYBR Green qPCR Kit (TaKaRa, Dalian, China). The PCR primers used for detecting C8orf34-as1, miR-671-5p, MFAP4, U6, and glyceraldehyde 3-phosphate dehydrogenase (GAPDH) were purchased from Sangon Biotech Co. Ltd. (Shanghai, China) and are listed in Table 2.
Table 2.
Primers Used for PCR Validation
| Gene | Primer Sequence of Genes |
|---|---|
| C8orf34-as1 | F: 5′-CAGGGGACCGATCTTGTTCT-3′ |
| R: 5′-AGTGCTCAGTCTTCACCTT-3′ | |
| MFAP4 | F: 5′-TACCAGTCAGACGGCGTGTA-3′ |
| R: 5′-CCACTCGCAGCTCATACTTCT-3′ | |
| has-miR-671-5p | F: 5′-CCTAACACTAAGGATCACGGA-3′ |
| R: 5′-CATCCACACCAAAGGGGGAA-3′ | |
| U6 | F: 5′-TGCGGG TGCTCGCTTCGGCAGC-3′ |
| R: 5′-CCAGTGCAGGGTCCGAGGT-3′ | |
| GAPDH | F: 5′-TGAAGGTCGGAGTCAACGGATTTGGT-3′ |
| R: 5′-CATGTGGGCCATGAGGTCCACCAC-3′ |
Western Blotting and Transwell Assay
Total protein was extracted by radioimmunoprecipitation assay (RIPA) lysis buffer. The protein extracts were resolved by 15% SDS-polyacrylamide gel electrophoresis and transferred onto polyvinylidene difluoride (PVDF) membranes. Subsequently, the membranes were blocked with 5% fat-free milk at room temperature for 1 h and then incubated with primary antibodies targeting MFAP4 (1:1,000; Abcam, Cambridge, MA, USA), SOX2 (1:1,000; Cell Signaling Technology Inc., Danvers, MA, USA), OCT4 (1:500; Abcam), and NANOG (1:1,000; Cell Signaling Technology Inc.) at 4°C overnight. Following incubation with the secondary antibody for 1 h at room temperature, the protein bands were visualized with ECL substrate (Millipore, Boston, MA, USA). Transwell chambers were used to determine cell invasion ability. In brief, transfected cells were seeded into the upper chamber precoated with Matrigel. Then 300 μl of serum-free medium was added to the upper chamber, while 500 μl of medium containing 10% FBS was added to the lower chamber. After incubation for 24 h, the invaded cells were stained with a 10% crystal violet solution (Sigma-Aldrich, St. Louis, MO, USA) for 15 min. The cells in five different fields of view were counted under a microscope.
Luciferase Assay
The lncRNA C8orf34-as1 or MFAP4 3′-untranslated region (3′-UTR) sequence containing a putative target site or mutated target site for miR-671-5p was synthesized and cloned into the pGL3 reporter vector (Promega, Madison, WI, USA) to form luciferase reporter vectors (pGL3-C8orf34-as1-WT/pGL3-C8orf34-as1-MUT and pGL3-MFAP4-WT/pGL3-MFAP4-MUT). For the luciferase reporter assay, the wild-type (WT) or mutant luciferase reporter vector was cotransfected with miR-671-5p mimics or miR-26a-5p NC into HEK 293T cells using Lipofectamine 3000. pRL-TK (Promega) was also cotransfected into cells for a normalization control. At 48 h after transfection, the Renilla and firefly luciferase activity was determined with a dual-luciferase reporter assay kit (Promega).
Sphere Formation Assays
Single cells (1 × 10³ cells/well) were seeded onto a 24-well ultra-low attachment plate (Corning Inc., Corning, NY, USA) with serum-free DMEM/F12 medium composed of 1% B27 (17504-044; Gibco, Thermo Fisher), 20 ng/ml recombinant human epidermal growth factor (Invitrogen), and 10 ng/ml recombinant human basic fibroblast growth factor (100-18B; PeproTech, Rocky Hill, NJ, USA). After 10 days of culture, the size and number of floating spheres (>50 μm) were counted under a Keyence microscope, and spheres were collected for further use.
Xenograft Mouse Model
BALB/c nude mice (Nu/Nu, female, 4 weeks old, n = 8) were purchased from the Kunming Institute of Zoology (Kunming, China) and housed and fed under pathogen-free conditions. All animal studies were performed in accordance with institutional guidelines and were approved by the Ethics Committee of the First Affiliated Hospital of Xi’an Jiaotong University. The mice were randomly divided into two groups (four mice for each group). LUAD xenografts were established by injection of 5 × 10⁶ LUAD cells transfected with scramble or Flag-MFAP4 directly into the flanks of the mice. Subsequently, tumor growth was measured every 4 days using the formula: volume = (length × width2)/2. At 4 weeks after injection, the mice were sacrificed, and the tumors formed were weighed and photographed.
Statistical Analysis
SPSS 18 (SPSS Inc., Chicago, IL, USA) and R Studio (version 3.6.1) were used for the statistical analyses mentioned above. Differential expression analysis was conducted by using the “limma” R package17. Statistical differences were compared by the Wilcoxon test between two groups, and the Kruskal–Wallis H test for multigroup comparisons. Differences were considered statistically significant with a value of p < 0.05.
RESULTS
Analysis of the Differential Expression and Functional Enrichment of DElncRNAs, DEmiRNAs, and DEmRNAs in LUAD
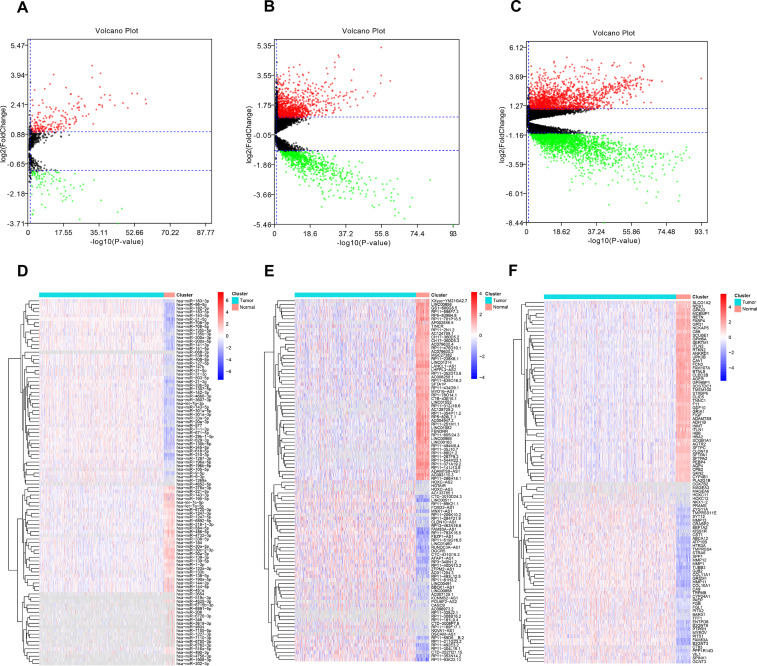
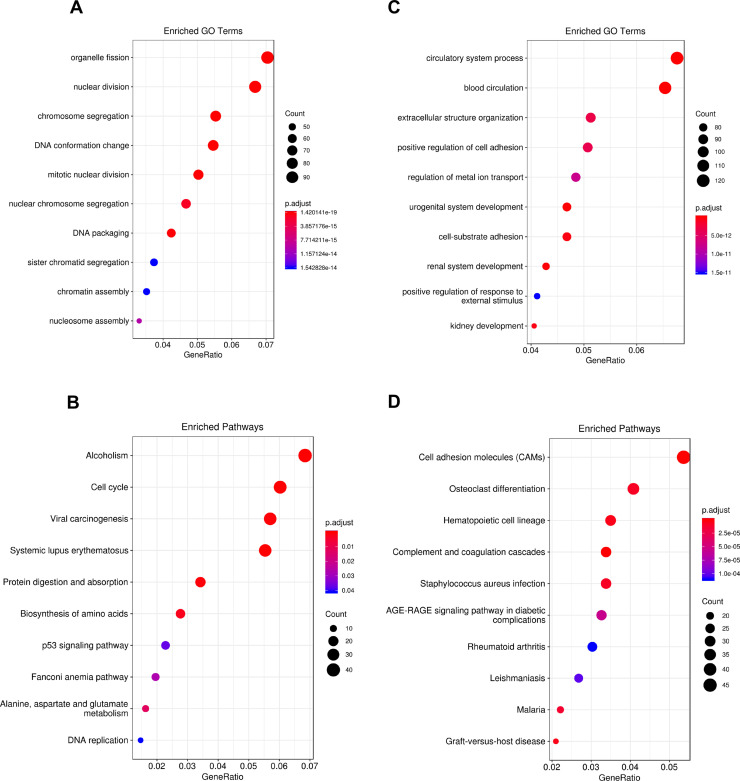
According to the cutoff threshold (|log2FC| > 1, FDR < 0.05), a total of 3,742 DEmRNAs (including 1,662 upregulated and 2,080 downregulated) (supplementary Table 1, available at https://drive.google.com/file/d/1unMe_dU37XNyfup0FQvfzylI8JAVLj19/view?usp=sharing), 1,825 DElncRNAs (including 1,057 upregulated and 768 downregulated) (supplementary Table 2, available at https://drive.google.com/file/d/1unMe_dU37XNyfup0FQvfzylI8JAVLj19/view?usp=sharing), and 291 DEmiRNAs (including 204 upregulated and 87 downregulated) (supplementary Table 3, available at https://drive.google.com/file/d/1unMe_dU37XNyfup0FQvfzylI8JAVLj19/view?usp=sharing) were identified in LUAD tissues compared to normal tissues. The DEmRNAs, DElncRNAs, and DEmiRNAs were visually displayed by a volcano map (Fig. 2A–C). The heat maps of clustering analysis distinctly depict the expression of the top 100 differentially expressed RNAs in LUAD and normal tissues (Fig. 2D–F). Next, we performed GO and KEGG pathway analyses to identify the biological functions and key pathways of the DEmRNAs. The GO terms of the upregulated DEmRNAs were mainly enriched in organelle fission, nuclear division, and chromosome segregation (Fig. 3A), while the main functions of the downregulated DEmRNAs were mainly involved in circulatory system process, blood circulation, and extracellular structure organization (Fig. 3B). Similar to the GO results, the KEGG pathways of the upregulated DEmRNAs were enriched in alcoholism, cell cycle, and viral carcinogenesis (Fig. 3C). The KEGG pathways associated with the downregulated DEmRNAs included cell adhesion molecules (CAMs), osteoclast differentiation factors, and hematopoietic cell lineage (Fig. 3D).
Figure 2.
Volcano maps and heat maps of differentially expressed RNAs between lung adenocarcinoma (LUAD) tissues and normal tissues. The gray color represents genes or noncoding RNAs with no available value in LUAD samples. (A–C) Volcano maps of differentially expressed microRNAs (miRNAs), long noncoding RNAs (lncRNAs), and mRNAs. Red dots represent upregulated RNAs, and green dots represent downregulated RNAs. (D–F) Heat maps of differentially expressed miRNAs, lncRNAs, and mRNAs. All hierarchical clustering heat maps show only the top 100 differentially expressed RNAs.
Figure 3.
Gene Ontology (GO) and Kyoto Encyclopedia of Genes and Genomes (KEGG) analyses. (A, B) The 10 most enriched GO pathways of the upregulated and downregulated differentially expressed mRNAs (DEmRNAs). (C, D) The 10 most enriched KEGG pathways of the upregulated and downregulated DEmRNAs.
ceRNA Network Construction and Prognostic Analysis
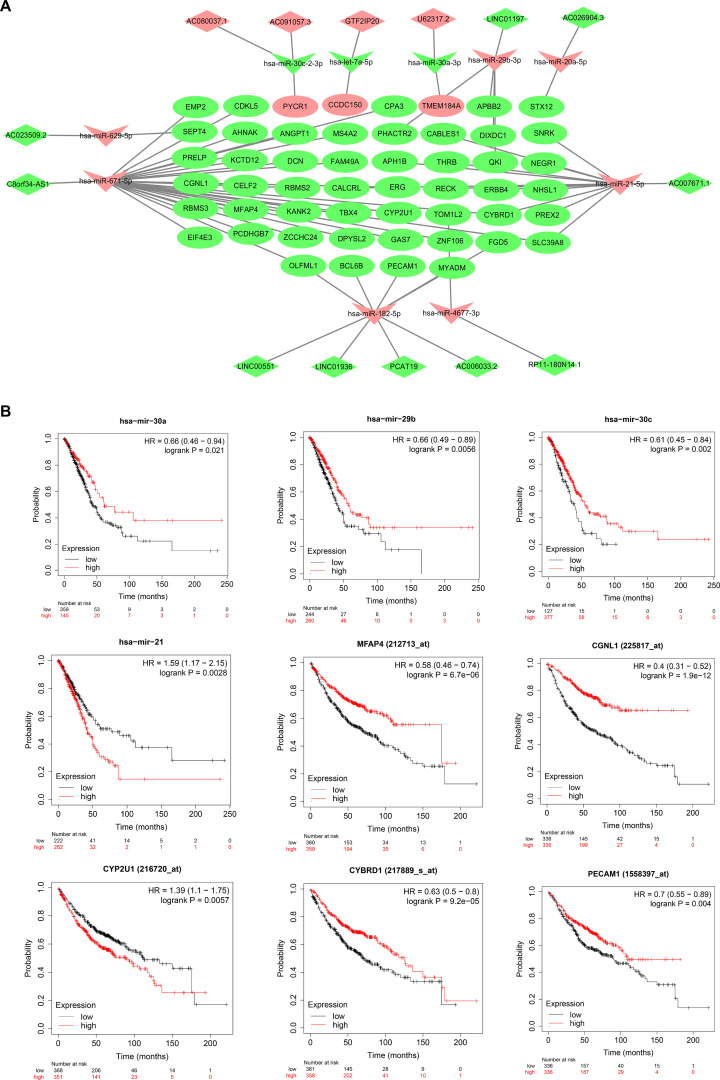
According to the description in the Methods and Materials section, the binding relationship of DEmiRNA–DEmRNA pairs and DElncRNA–DEmiRNA pairs constructed the ceRNA regulatory network and was visualized by Cytoscape 3.5.0 (http://cytoscape.org/) (Fig. 4A). The ceRNA network consisted of 14 lncRNAs (10 downregulated and 4 upregulated) (Table 3), 10 miRNAs (3 downregulated and 7 upregulated) (Table 3), and 52 mRNAs (49 downregulated and 3 upregulated) (Table 4).
Figure 4.
ceRNA network construction in LUAD. (A) The lncRNA–miRNA–mRNA ceRNA network. Vs indicate miRNAs, diamonds indicate lncRNAs, and ellipses indicate mRNAs. The upregulated and downregulated RNAs are represented in highlighted red nodes and green nodes, respectively. (B) Kaplan–Meier survival curves for the nine representative DEmRNAs significantly associated with the overall survival of LUAD patients. The remaining survival curves of the prognostic DEmRNAs can be obtained from KM plotter, and those of the prognostic DEmiRNAs or DElncRNAs can be obtained from starBase v3.0.
Table 3.
Specific lncRNAs That Target Specific miRNAs
| lncRNAs | miRNAs |
|---|---|
| AC080037.1 | hsa-miR-30c-2-3p |
| AC091057.3 | hsa-miR-30c-2-3p |
| GTF2IP20 | hsa-let-7a-5p |
| U62317.2 | hsa-miR-30a-3p |
| LINC01197 | hsa-miR-29b-3p |
| AC026904.3 | hsa-miR-20a-5p |
| AC007671.1 | hsa-miR-21-5p |
| RP11-180N14.1 | hsa-miR-4677-3p |
| AC006033.2 | hsa-miR-182-5p |
| PCAT19 | hsa-miR-182-5p |
| LINC01936 | hsa-miR-182-5p |
| LINC00551 | hsa-miR-182-5p |
| AC023509.2 | hsa-miR-629-5p |
| C8orf34-AS1 | hsa-miR-671-5p |
Table 4.
Specific miRNAs That Target Specific mRNAs
| miRNAs | mRNAs |
|---|---|
| hsa-miR-30c-2-3p | PYCR1 |
| hsa-let-7a-5p | CCDC100 |
| hsa-miR-30a-3p | TMEM184A |
| hsa-miR-29b-3p | PHACTR2, DIXDC1, QKI, APBB2 |
| hsa-miR-20a-5p | STX12 |
| hsa-miR-21-5p | RECK, ERBB4, CYBRD1, CALCRL, CABLES1, APH1B, NEGR1, SNRK, PREX2, SLC39A8, NHSL1, THRB |
| hsa-miR-4677-3p | TOM1L2 |
| hsa-miR-182-5p | PECAM1, MYADM, SYNE3, FGD5, OLFML1, BCL6B |
| hsa-miR-629-5p | SETP4 |
| hsa-miR-671-5p | FAM49A, CDKL5, CYBRD1, ZNF106, DPYSL2, CGNL1, TBX4, ERG, KCTD12, RBMS2, CPA3, ANGPT1, CELF2, PRELP, SLC39A8, DCN, MS4A2, AHNAK, CYP2U1, RBMS3, OLFML1, PCDHGB7, EMP2, EIF4E3, ZCCHC24, GAS7, MFAP4, KANK2 |
The Kaplan–Meier survival curves of the RNAs in the ceRNA network were obtained by using starBase v3.0 and KM plotter. As a result, 2 DEmiRNAs (hsa-mir-21-5p and hsa-mir-29b-3p), 5 DElncRNAs (AC006033.2, AC007671.1, AC091057.3, C8orf34-AS1, and LINC01936), and 41 DEmRNAs (EMP2, PRELP, CGNL1, EIF4E3, AHNAK, KCTD12, CELF2, MFAP4, PYCR1, DCN, KANK2, ZCCHC24, OLFML1, CCDC150, MS4A2, FAM49A, CALCRL, DPYSL2, BCL6B, CPA3, PHACTR2, APH1B, ERG, CYP2U1, GAS7, CABLES1, THRB, RECK, TOM1L2, MYADM, APBB2, DIXDC1, QKI, CYBRD1, FGD5, STX12, SNRK, NEGR1, NHSL1, RBMS3, and ANGPT1) were identified as prognosis-related RNAs (Fig. 4B, supplementary Figs. 1–4, available at https://drive.google.com/file/d/1unMe_dU37XNyfup0FQvfzylI8JAVLj19/view?usp=sharing).
Weighted Coexpression Network Construction
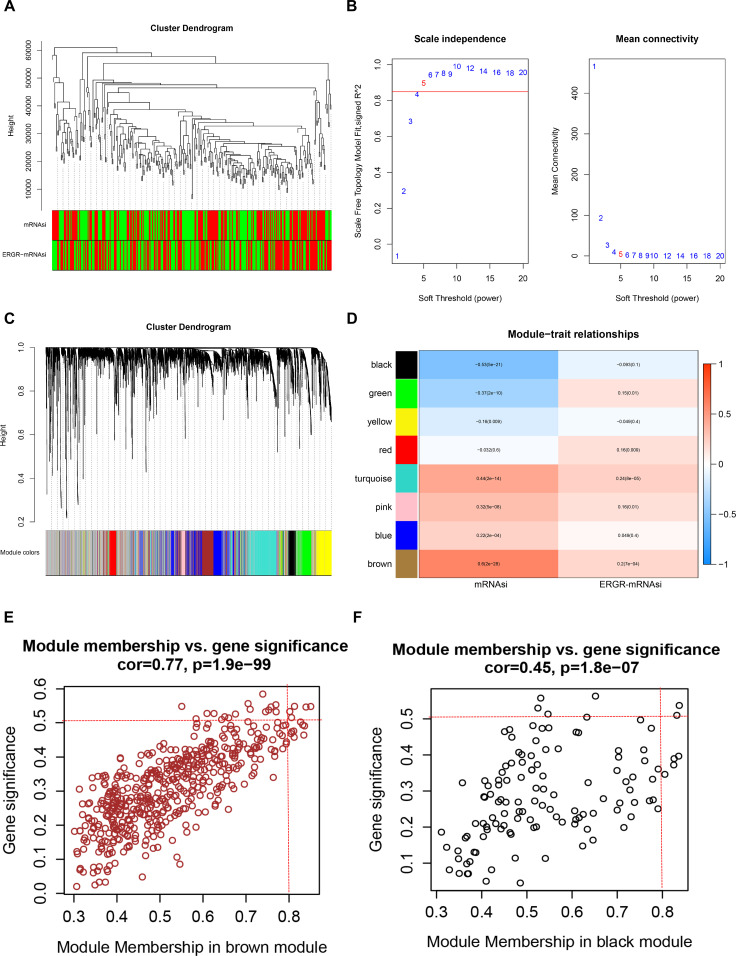
We used the data profile of the DEmRNAs to construct a weighted gene coexpression network, identifying the correlations between the DEmRNAs and stemness indexes. After outlier samples were eliminated, the 4,082 DEmRNAs with the highest 50% of variance by cluster analysis were placed in a module (Fig. 5A). We then selected β = 5 (scale-free R 2 = 0.950) as a soft threshold to establish a scale-free network (Fig. 5B and C). A total of nine gene modules were identified via average linkage hierarchical clustering (Fig. 5D). The correlation of the gene module and stemness indexes (mRNAsi and EREG–mRNAsi) was analyzed to find the clinically significant module (Fig. 5E). The brown module (R 2 = 0.6, p = 2.0e-28) was most significantly positively associated with mRNAsi (Fig. 5F). In addition, the black module (R 2 = −0.53, p = 5.0e-28) exhibited a relatively high negative correlation with mRNAsi (Fig. 5G). Then the selection criteria for key genes in the mRNAsi group were defined as cor.MM > 0.8 and cor.|GS| > 0.5. Finally, we screened five key genes (CCNB1, CCNB2, RRM2, BIRC5, and NUSAP1) from the brown module and two key genes (AOC3 and MFAP4) from the black module.
Figure 5.
Screening for stemness-related gene modules in LUAD by WGCNA. (A) Hierarchical clustering of hub genes in the clustering analysis. The red color represents the samples marked as nonzero in the phenotype, and the green color indicates the samples marked as zero in the phenotype. (B) Analysis of network topology for different soft-thresholding powers. (C) Hierarchical clustering of the gene module based on the module eigengene. (D) Heat map of the correlation between consensus module eigengenes and clinical features in The Cancer Genome Atlas (TCGA) cohort. (E, F) The scatter plot of the top two important gene modules: brown module (E) and (F) black module.
Identification of a Novel ceRNA Regulatory Axis
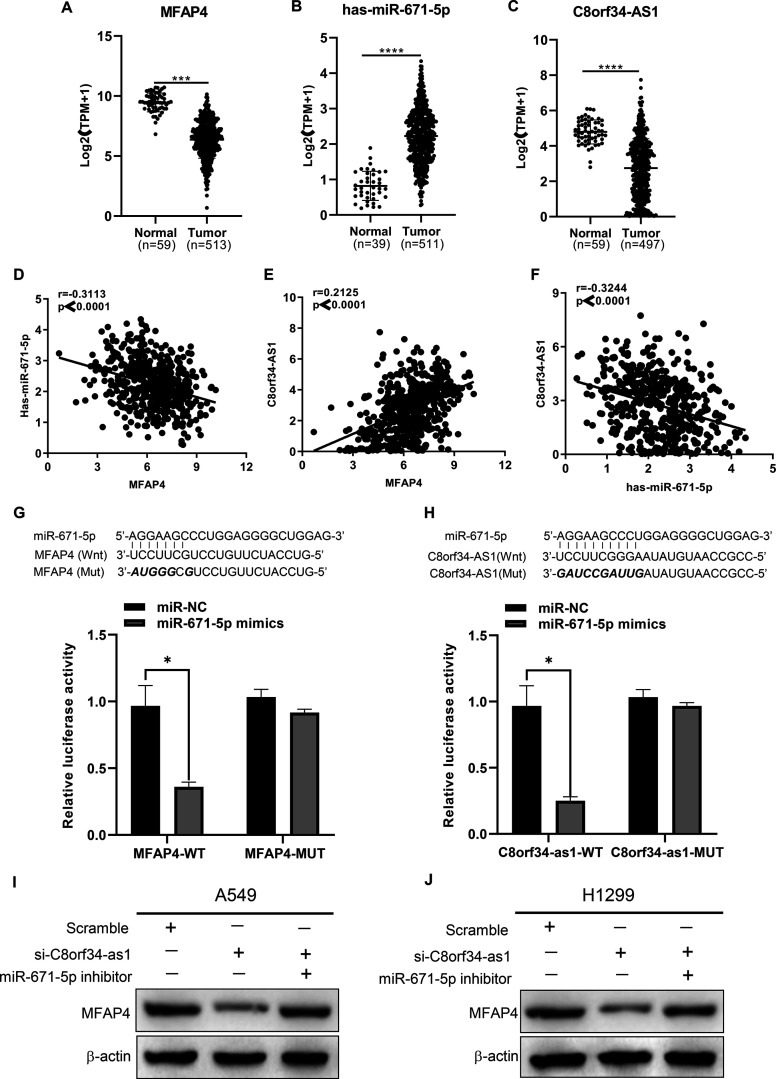
To further explore the biological functions and regulatory mechanisms of these key genes in LUAD, one key gene (MFAP4) was screened out by intersecting the ceRNA network with the weighted gene coexpression network. According to the aforementioned ceRNA network, we predicted that the lncRNA C8orf34-as1 may act as a ceRNA by competitively sponging miR-671-5p to regulate MFAP4 expression. To verify our prediction, TCGA data analysis was performed and indicated that C8orf34-as1 and MFAP4 expression was significantly lower in LUAD tissues than in normal lung tissues, while miR-671 expression was the opposite (p < 0.0001) (Fig. 6A–C). Subsequently, Spearman’s correlation analysis showed that MFAP4 was positively correlated with C8orf34-as1 expression (r = 0.2125, p < 0.0001) (Fig. 6E) but negatively associated with miR-671-5p expression (r = −0.3113, p < 0.0001) (Fig. 6D). Moreover, C8orf34-as1 expression was negatively correlated with miR-671-5p levels (r = −0.3244, p < 0.0001) (Fig. 6F). We next utilized a dual-luciferase reporter system to verify the ceRNA regulatory relationship among C8orf34-as1, miR-671-5p, and MFAP4. As shown in Figure 6G and H (upper row), the 3′-UTR regions of MFAP4 or C8orf34-as1 contain a highly conserved putative binding site of miR-671-5p. The dual-luciferase reporter assay revealed that the ectopic expression of the miR-671-5p mimics decreased MFAP4-wt reporter or C8orf34-as1-wt reporter luciferase activity in HEK 293T cells, whereas no significant luciferase activity was observed in the mutant group (p < 0.05) (Fig. 6G and H, lower row). In addition, Western blot analyses showed that the knockdown of C8orf34-as1 markedly reduced MFAP4 expression in H1299 and A549 cells; this reduced expression was reversed by miR-671-5p inhibitors (Fig. 6I and J) (the statistical analysis of the Western blot results is displayed in supplementary Fig. 5). These data collectively demonstrate that C8orf34-as1 acts as an endogenous sponge by binding to miR-671-5p and thus abolishing miRNA-induced MFAP4 suppression.
Figure 6.
Identification of a ceRNA regulatory axis in LUAD cells. (A–C) Differential expression of MFAP4, hsa-miR-671-5p, and C8orf34-as1 between normal and LUAD tissues from the TCGA cohort. ***p < 0.001, ****p < 0.0001. (D) The correlation between MFAP4 and miR-671-5p, r = −0.3113, p < 0.0001. (E) The correlation between MFAP4 and C8orf-as1, r = 0.2125, p < 0.0001. (F) The correlation between miR-671-5p and C8orf-as1, r = −0.3244, p < 0.0001. (G) Luciferase reporter assays were used to assess the direct relationship between MFAP4 and miR-671-5p. Sequence alignment of MFAP4 and miR-671-5p (in bold). The mutant sequence is shown. *p < 0.05. (H) Luciferase reporter assays were used to assess the direct relationship between C8orf34-as1 and miR-671-5p. Sequence alignment of C8orf34-as1 and miR-671-5p (in bold). The mutant sequence is shown. *p < 0.05. (I, J) MFAP4 protein levels were measured in A549 and H1299 cells after cotransfection with si-C8orf34-as1 with or without the miR-671-5p inhibitor.
Functional Analysis of the C8orf34-as1/miR-671-5p/MFAP4 Regulatory Axis In Vitro and In Vivo
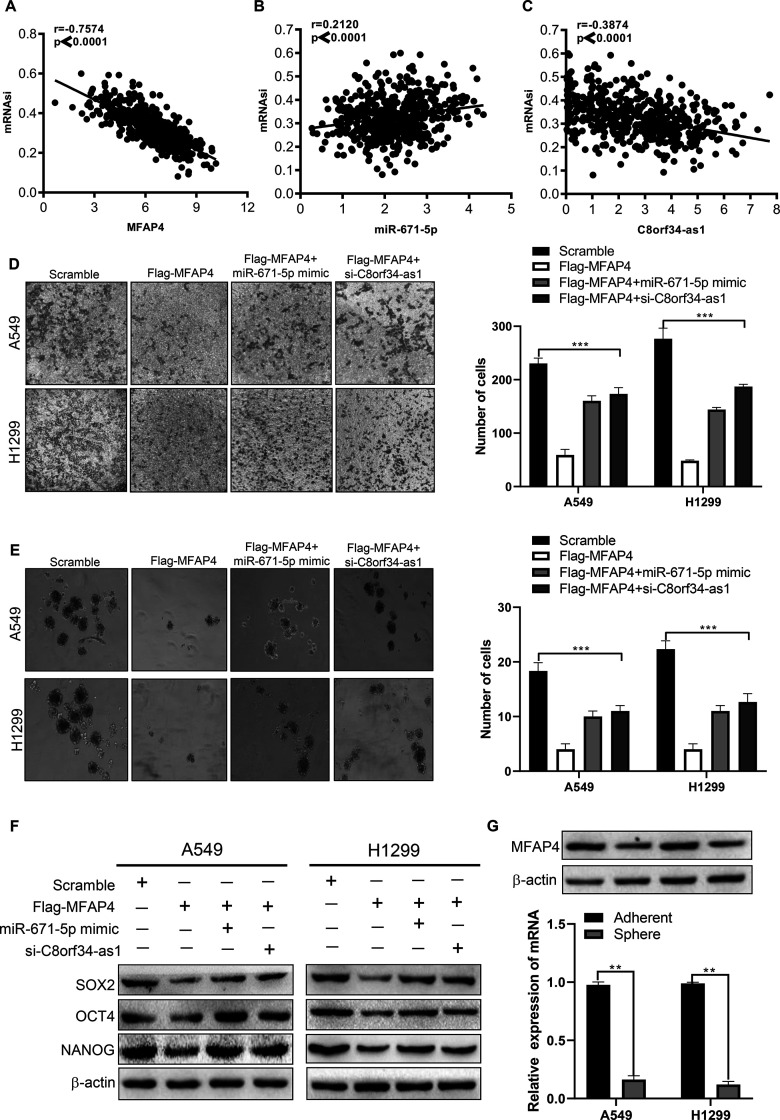
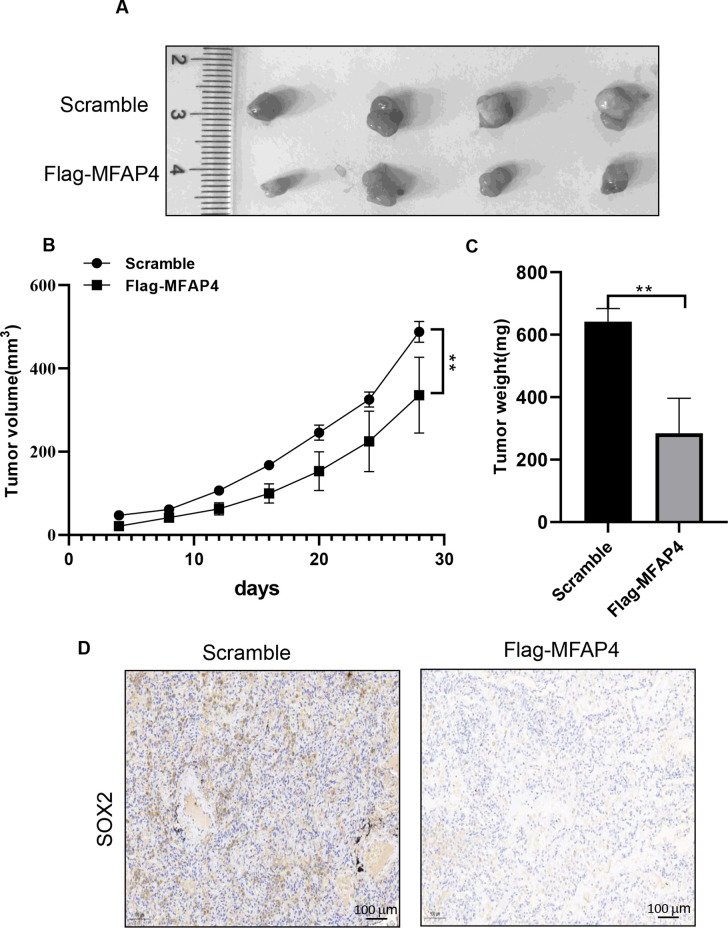
To further verify whether C8orf34-as1/miR-671-5p modulates cell invasion and stemness in an MFAP4-mediated manner, we first assessed the correlation between mRNAsi and the ceRNA regulatory axis. As shown in Figure 7, high mRNAsi was associated with lower C8orf34-as1 (r = −0.3874, p < 0.0001) and MFAP4 (r = −0.7571, p < 0.0001) (Fig. 7A) expression but with higher miR-671-5p (r = 0.2120, p < 0.0001) (Fig. 7B) expression in the TCGA-LUAD samples. We then investigated whether the C8orf34-as1/miR-671/MFAP4 axis is critical for cell invasion and cancer stemness in LUAD cells. The Transwell assay results showed that the invasive inhibition induced by Flag-MFAP4 could be reversed by miR-671-5p mimics or si-C8orf34-as1 (p < 0.001) (Fig. 7D). The tumor sphere formation assay was used to investigate the effects of the ceRNA regulatory axis on the regulation of stem cell renewal. Notably, reintroducing MFAP4 into A549 and H1299 cells formed fewer spheres with smaller sizes, and the inhibitory effect was reversed by miR-671-5p mimics or si-C8orf34-as1 (p < 0.001) (Fig. 7E). Furthermore, the RNA and protein levels of MFAP4 were found to be markedly downregulated in sphere cells compared to the parental adherent cells (p < 0.01) (Fig. 7G). Finally, Western blot analysis showed that Flag-MFAP4 significantly decreased the protein expression of stemness markers (SOX2, OCT4, and NANOG) in LUAD cells, and these effects could be rescued by miR-671-5p mimics or si-C8orf34-as1 (Fig. 7F) (the statistical analysis of the Western blot results is shown in supplementary Figure 6). In addition, animal experiments confirmed that MFAP4 overexpression significantly inhibited tumor growth in vivo (p < 0.01) (Fig. 8A–C). Collectively, these findings are consistent with our hypothesis and indicate that the C8orf34-as1/miR-671/MFAP4 axis plays a key role in the regulation of cell invasion and stemness in LUAD.
Figure 7.
The C8orf34-as1–miR-671-5p–MFAP4 axis is critical for LUAD cell invasion and stemness. (A–C) Pearson correlation analysis of the relationship between MFAP4, miR-671-5p, or C8orf34-as1 expression and the mRNAsi score. (D) Transwell assays were performed to determine invasion in A549 and H1299 cells after different treatments. ***p < 0.001. (E) Sphere formation assays were performed to analyze stemness in A549 and H1299 cells after different treatments. ***p < 0.001. (F) Western blot assays were performed to analyze the effect of C8orf34-as1/miR-671-5p/MFAP4 on three key stemness-related genes (SOX2, OCT4, and NANOG). (G) Real-time quantitative polymerase chain reaction (RT-qPCR) and immunoblot showing decreased MFAP4 expression in spherical cells compared to adherent cells, **p < 0.01.
Figure 8.
MFAP4 inhibited the tumor growth in vivo. (A) Representative images of xenograft tumors are shown. (B) Volumes of the xenograft tumors were measured and used to draw a growth curve. (C) Weights of the xenograft tumors were measured and analyzed. (D) Representative immunohistochemistry images of SOX2 in the scramble group and Flag-MFAP4 group were obtained from xenograft tumors. **p < 0.01.
DISCUSSION
As the most common histological type of NSCLC, LUAD causes approximately 500,000 deaths worldwide each year. Despite the significant advances made in revealing the mechanisms of LUAD, the exact pathogenesis is inadequately understood. In 2011, Pandolfi and colleagues first proposed a new RNA regulation hypothesis in which different RNA transcripts can talk to each other through MREs, which is called “the ceRNA hypothesis”2. It unfolds a novel concept for lncRNA–miRNA–mRNA regulatory cross talk that provides an in-depth understanding of the mechanisms of various diseases, especially cancer.
In this study, we identified DElncRNAs, DEmiRNAs, and DEmRNAs between LUAD tissues and normal tissues from the TCGA–LUAD data set. Afterward, a miRNA-mediated lncRNA–mRNA ceRNA network was constructed and integrated to reveal potential LUAD-specific RNA biomarkers. All differentially expressed RNAs involved in the ceRNA network were extracted to analyze the association between their expression and prognosis in LUAD patients. GO and KEGG pathway analyses of the DEmRNAs were performed to further reveal DEmRNA-related biological functions and key pathways in the development of LUAD. Moreover, we constructed a gene coexpression network by using WGCNA and identified one gene (MFAP4) involved in the ceRNA network that was closely related to cancer stemness.
Our further analysis found a novel cancer stemness-related ceRNA axis (C8orf34-as1/miR-671-5p/MFAP4) in LUAD. As mentioned in the results, low expression of C8orf34-as1 and MFAP4 was correlated with the poor prognosis of LUAD patients. Microfibrillar-associated protein 4 (MFAP4) is an extracellular glycoprotein that colocalizes with collagen and elastin fibers. It consists of a C-terminal fibrinogen-like domain and an Arg–Gly–Asp (RGD) sequence in the N-terminal region, which mainly functions as a ligand motif for cell surface integrins and may be involved in cell adhesive activity20. Recently, several studies have reported that the dysregulation of MFAP4 protein exists in a variety of malignant tumors21. For example, Davalieva et al. and Zaravinos et al. identified that MFAP4 serves as a tumor suppressor in prostate cancer22 and urinary bladder cancer23. In a study by Feng et al., miR-147b promoted malignant aggressiveness in LUAD cells by targeting MFAP424. Thus, MFAP4 mainly functions as a suppressor gene in most human tumors. As expected, the similar results from Zhang et al.’s study confirmed that MFAP4 has high stem cell properties in LUAD samples by WGCNA and mRNAsi. Interestingly, the above study also identified a stemness-related gene (PECAM1), which was also included in the above constructed ceRNA regulatory network14. Currently, several studies have revealed that miR-671-5p may play a role in suppressing or promoting cancer in various tumors25–28. However, there are few studies on the role of miR-671-5p in LUAD. With regard to C8orf34-as1, only one article mentioned that it is closely related to the prognosis of LUAD29. Therefore, these findings are worthy of future research.
In this study, we successfully constructed a LUAD-specific ceRNA network by using a large cohort from the TCGA database. Based on WGCNA, we further identified seven hub genes associated with cancer stemness in LUAD. Finally, we obtained and identified one ceRNA regulatory axis that correlates with the cell invasion and stemness of LUAD through comparative integration. Our results may shed light on the understanding of novel predictive marker biomarkers that can be used to guide basic and clinical research on LUAD.
ACKNOWLEDGMENTS
The authors acknowledge the staff of the Key Laboratory of Environment and Genes Related to Disease, Ministry of Education, for their technical assistance. The authors acknowledge assistants in the Center for Translational Medicine of the First Affiliated Hospital of Xi’an Jiaotong University for their technical assistance. This study was supported by the Chinese National Science Foundation for Young Scientists of China, Grant No. 81602597 (to Xin Sun). All coauthors involved in this research approved this article to be published. Supplemental information includes seven figures and three tables and can be accessed online at https://drive.google.com/file/d/1unMe_dU37XNyfup0FQvfzylI8JAVLj19/view?usp=sharing.
Footnotes
The authors declare no conflicts of interest.
REFERENCES
- 1.Tsim S, O’Dowd CA, Milroy R, Davidson S. Staging of non-small cell lung cancer (NSCLC): A review. Respir Med. 2010;104(12):1767–74. [DOI] [PubMed] [Google Scholar]
- 2.Salmena L, Poliseno L, Tay Y, Kats L, Pandolfi PP. A ceRNA hypothesis: The Rosetta Stone of a hidden RNA language? Cell 2011;146(3):353–8. [DOI] [PMC free article] [PubMed] [Google Scholar]
- 3.Sun X, Liu J, Xu C, Tang SC, Ren H. The insights of Let-7 miRNAs in oncogenesis and stem cell potency. J Cell Mol Med. 2016;20(9):1779–88. [DOI] [PMC free article] [PubMed] [Google Scholar]
- 4.Sun X. FAM83A-AS1 promotes lung adenocarcinoma cell migration and invasion by targeting miR-150-5p and modifying MMP14. Cell Cycle (Georgetown, Tex.) 2019(9):1–14. [DOI] [PMC free article] [PubMed] [Google Scholar]
- 5.Langfelder P, Horvath S. WGCNA: An R package for weighted correlation network analysis. BMC Bioinformatics 2008;9:559. [DOI] [PMC free article] [PubMed] [Google Scholar]
- 6.Esposti DD, Hernandez-Vargas H, Voegele C, Fernandez-Jimenez N, Herceg Z. Identification of novel long non-coding RNAs deregulated in hepatocellular carcinoma using RNA-sequencing. Oncotarget 2016;7(22):31862–77. [DOI] [PMC free article] [PubMed] [Google Scholar]
- 7.Shi K, Bing ZT, Cao GQ, Guo L, Cao YN, Jiang HO, Zhang MX. Identify the signature genes for diagnose of uveal melanoma by weight gene co-expression network analysis. Int J Ophthalmol. 2015;8(2):269–74. [DOI] [PMC free article] [PubMed] [Google Scholar]
- 8.Raggi C, Mousa H, Correnti M, Sica A, Invernizzi P. Cancer stem cells and tumor-associated macrophages: A roadmap for multitargeting strategies. Oncogene 2016;35(6):671–82. [DOI] [PubMed] [Google Scholar]
- 9.Eramo A, Haas T, De Maria RJO. Lung cancer stem cells: Tools and targets to fight lung cancer. Oncogene 2010;29(33):4625–35. [DOI] [PubMed] [Google Scholar]
- 10.Koren A, Motaln H, Cufer TJCO. Lung cancer stem cells: A biological and clinical perspective. Cell Oncol (Dordr). 2013;36(4):265–75. [DOI] [PubMed] [Google Scholar]
- 11.Freitas DP, Teixeira CA, Santos-Silva F, Vasconcelos MH, Almeida GM. Therapy-induced enrichment of putative lung cancer stem-like cells. Int J Cancer 2014;134(6):1270–8. [DOI] [PubMed] [Google Scholar]
- 12.Tièche CC, Peng R-W, Dorn P, Froment L, Schmid RA, Marti TM. Prolonged pemetrexed pretreatment augments persistence of cisplatin-induced DNA damage and eliminates resistant lung cancer stem-like cells associated with EMT. BMC Cancer 2016;16(1):125. [DOI] [PMC free article] [PubMed] [Google Scholar]
- 13.Malta TM, Sokolov A, Gentles AJ, Burzykowski T, Poisson L, Weinstein JN, Kamińska B, Huelsken J, Omberg L, Gevaert O. Machine learning identifies stemness features associated with oncogenic dedifferentiation. Cell 2018;173(2):338–54. [DOI] [PMC free article] [PubMed] [Google Scholar]
- 14.Zhang Y, Tseng JT-C, Lien I, Li F, Wu W, Li H. mRNAsi index: Machine learning in mining lung adenocarcinoma stem cell biomarkers. Genes 2020;11(3):257. [DOI] [PMC free article] [PubMed] [Google Scholar]
- 15.Zhao M, Chen Z, Zheng Y, Liang J, Hu Z, Bian Y, Jiang T, Li M, Zhan C, Feng MJJoCR and others. Identification of cancer stem cell-related biomarkers in lung adenocarcinoma by stemness index and weighted correlation network analysis. J Cancer Res Clin Oncol. 2020;146(6):1463–72. [DOI] [PubMed] [Google Scholar]
- 16.Cancer Genome Atlas Research Network. Comprehensive molecular profiling of lung adenocarcinoma. Nature 2014;511(7511):543–50. [DOI] [PMC free article] [PubMed] [Google Scholar]
- 17.Ritchie ME, Phipson B, Wu D, Hu Y, Law CW, Shi W, Smyth GK. limma powers differential expression analyses for RNA-sequencing and microarray studies. Nucleic Acids Res. 2015;43(7):e47. [DOI] [PMC free article] [PubMed] [Google Scholar]
- 18.Győrffy B, Surowiak P, Budczies J, Lánczky A. Online survival analysis software to assess the prognostic value of biomarkers using transcriptomic data in non-small-cell lung cancer. PloS One 2013;8(12). [DOI] [PMC free article] [PubMed] [Google Scholar]
- 19.Li J-H, Liu S, Zhou H, Qu L-H, Yang J-H. starBase v2. 0: Decoding miRNA-ceRNA, miRNA-ncRNA and protein–RNA interaction networks from large-scale CLIP-Seq data. Nucleic Acids Res. 2014;42(D1):D92–D97. [DOI] [PMC free article] [PubMed] [Google Scholar]
- 20.Wulf-Johansson H, Johansson SL, Schlosser A, Holm AT, Rasmussen LM, Mickley H, Diederichsen AC, Munkholm H, Poulsen TS, Tornøe I. Localization of microfibrillar-associated protein 4 (MFAP4) in human tissues: Clinical evaluation of serum MFAP4 and its association with various cardiovascular conditions. PLoS One. 2013;8(12):e82243. [DOI] [PMC free article] [PubMed] [Google Scholar]
- 21.Yang J, Song H, Chen L, Cao K, Zhang Y, Li Y, Hao X. Integrated analysis of microfibrillar-associated proteins reveals MFAP4 as a novel biomarker in human cancers. Epigenomics 2019;11(1):5–21. [DOI] [PubMed] [Google Scholar]
- 22.Davalieva K, Kostovska IM, Kiprijanovska S, Markoska K, Kubelka-Sabit K, Filipovski V, Stavridis S, Stankov O, Komina S, Petrusevska G. Proteomics analysis of malignant and benign prostate tissue by 2D DIGE/MS reveals new insights into proteins involved in prostate cancer. The Prostate 2015;75(14):1586–600. [DOI] [PubMed] [Google Scholar]
- 23.Zaravinos A, Lambrou GI, Boulalas I, Delakas D, Spandidos DA. Identification of common differentially expressed genes in urinary bladder cancer. PLoS One 2011;6(4):e18135. [DOI] [PMC free article] [PubMed] [Google Scholar]
- 24.Feng Y-Y, Liu C-H, Xue Y, Chen Y-Y, Wang Y-L, Wu X-Z. MicroRNA-147b promotes lung adenocarcinoma cell aggressiveness through negatively regulating microfibril-associated glycoprotein 4 (MFAP4) and affects prognosis of lung adenocarcinoma patients. Gene 2020;730:144316. [DOI] [PubMed] [Google Scholar]
- 25.Qiu T, Wang K, Li X, Jin J. miR-671-5p inhibits gastric cancer cell proliferation and promotes cell apoptosis by targeting URGCP. Exp Ther Med. 2018;16(6):4753–8. [DOI] [PMC free article] [PubMed] [Google Scholar]
- 26.Yu Y, Wang Z, Sun D, Zhou X, Wei X, Hou W, Ding Y, Ma Y, Hou Y. miR-671 promotes prostate cancer cell proliferation by targeting tumor suppressor SOX6. Eur J Pharmacol. 2018;823:65–71. [DOI] [PubMed] [Google Scholar]
- 27.Xin C, Lu S, Li Y, Zhang Y, Tian J, Zhang S, Yang S, Gao T, Xu J. miR-671-5p inhibits tumor proliferation by blocking cell cycle in osteosarcoma. DNA Cell Biol. 2019;38(9):996–1004. [DOI] [PubMed] [Google Scholar]
- 28.Li X, Nie C, Tian B, Tan X, Han W, Wang J, Jin Y, Li Y, Guan X, Hong A. miR-671-5p blocks the progression of human esophageal squamous cell carcinoma by suppressing FGFR2. Int J Biol Sci. 2019;15(9):1892. [DOI] [PMC free article] [PubMed] [Google Scholar]
- 29.Salavaty A, Rezvani Z, Najafi A. Survival analysis and functional annotation of long non-coding RNAs in lung adenocarcinoma. J Cell Mol Med. 2019;23(8):5600–17. [DOI] [PMC free article] [PubMed] [Google Scholar]


