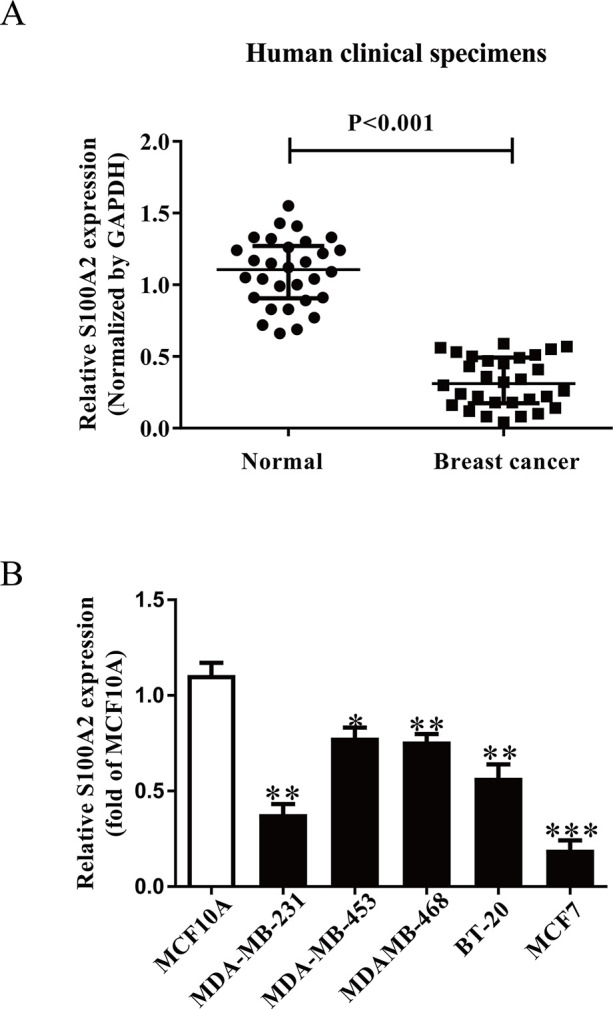
Figure 1.

The expressions and its effects of S100A2 in BC tissues and cell lines. (A) qRT-PCR analysis of S100A2 expression in breast cancer (BC) tissues and the adjacent tissues (n = 30). Transcript levels were normalized by GAPDH expression. (B) Relative S100A2 expression analyzed by qRT-PCR in five BC cell lines including MDA-MB-231, MDA-MB-453, MDAMB-468, BT-20, MCF7, and a human breast cell line MCF10A were normalized with GAPDH. All data are presented as mean ± SEM, n = 6. *p < 0.05, **p < 0.01, ***p < 0.001 versus normal or MCF10A.
