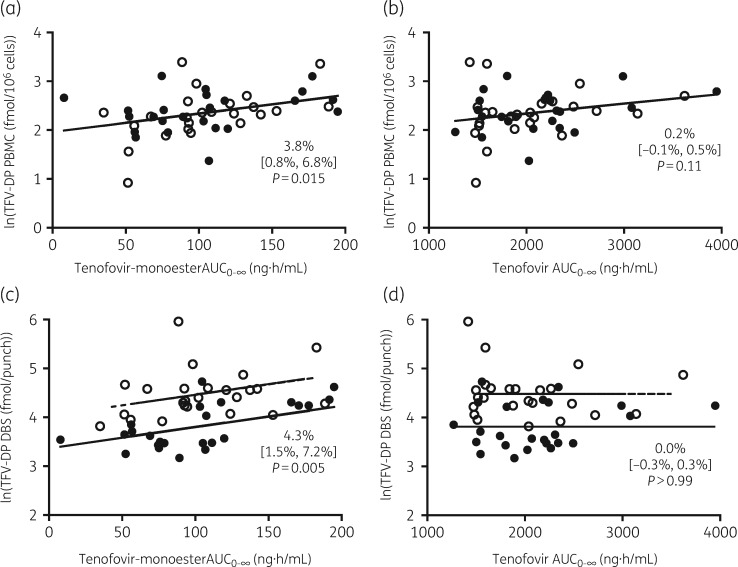
Figure 3.
Observed versus predicted plots of tenofovir diphosphate concentrations in PBMC with (a) tenofovir monoester and (b) tenofovir, and tenofovir diphosphate concentrations in DBS with (c) tenofovir monoester and (d) tenofovir. Data are presented as percentage change (95% CI). Filled circles indicate data points from visit 1. Open circles indicate data points from visit 2. Solid lines indicate predictions from all visits in PBMC and visit 1 in DBS, and dashed lines indicate predictions from visit 2.

