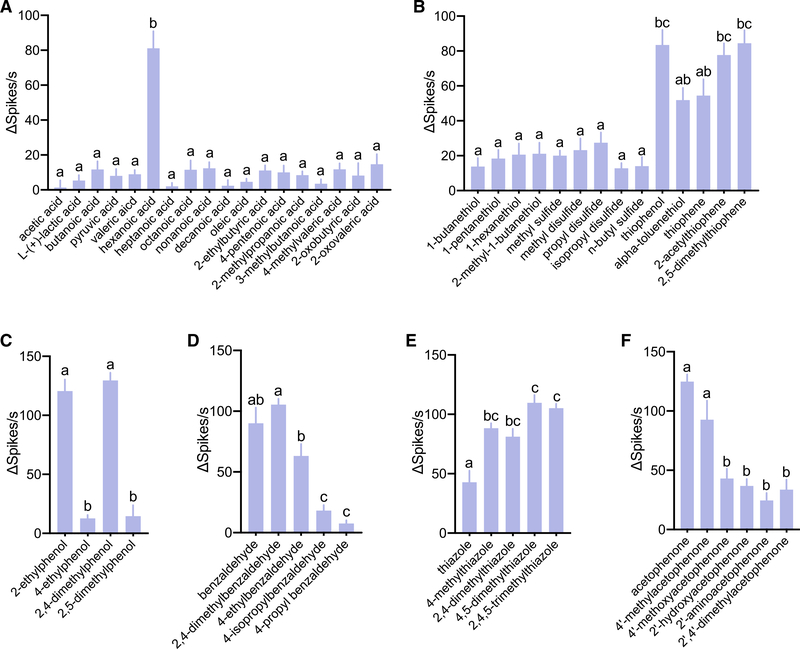
Figure 3. Responses of larval sensory cone to odorants with similar structures (n = 6).
(A–F) Responses of larval sensory cone to: (A) aliphatic carboxylic acids; (B) aliphatic and aromatic sulfurs; (C) ethylphenol-derived compounds; (D) benzaldehyde-derived compounds; (E) thiazole-derived compounds with increased alkane branches in the heterocyclic ring; and (F) acetophenone-derived compounds. Error bars indicate SEM. One-way ANOVA Tukey’s test was applied in the statistical analysis, with p < 0.05 indicating a significant difference. Different letters (a, b, c) indicate significant statistical differences (p < 0.05); those with the same letters are not statistically distinct.

