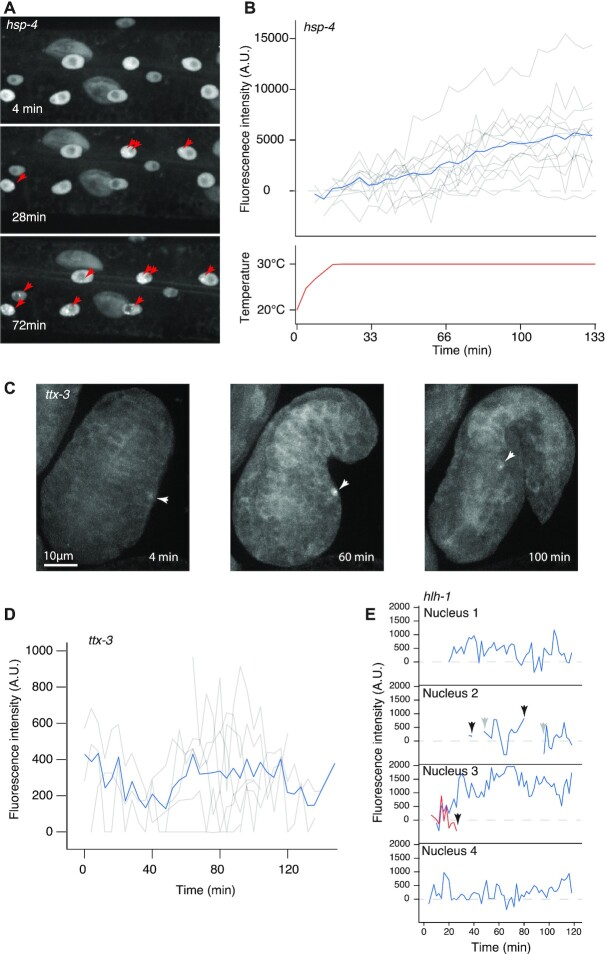
Figure 4.
NRDE-3 labelling reveals dynamics of transcription. (A) Induction of hsp-4 transcription in response to heat shock. Three frames showing apparition of hsp-4 transcription sites (red arrows) in an L4 larva over the course of heat shock at 30°C. (B) Dynamics of hsp-4 transcription sites in response to heat shock at 30°C. Fluorescence intensity of transcription foci in multiple nuclei of the same larva (top panel, grey lines) and their average (blue line) in response to temperature (bottom panel). (C) Dynamics of ttx-3 transcription in the embryo. Three frames showing the AIY nucleus (white arrowheads) before a transcription spot is visible, at 4 min; a bright transcription spot at 60 min, and a dimming spot, before it dropped below detection limit, at 100 min. (D) Fluorescence intensity of ttx-3 transcription spots of 10 embryos, temporally aligned based on embryo elongation. Average fluorescence intensity is represented as a blue line. (E) Fluorescence intensity of hlh-1 transcription spots in muscle nuclei in an L4 larva. In nucleus 2, the transcription spot dropped below detection limits for more than two timeframes (black arrows) before reappearing (grey arrows). In nucleus 3, two transcription spots were present, one disappeared.

