Figure 5.
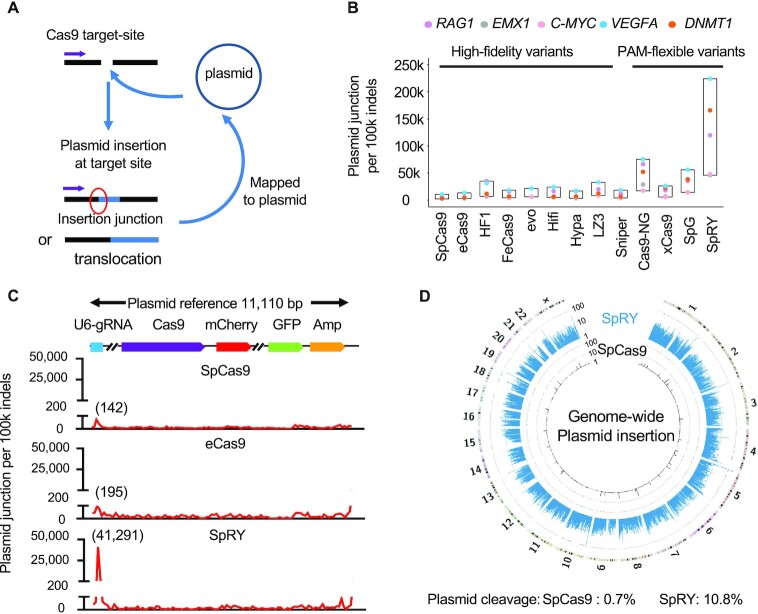
Plasmid cleavage for SpCas9 PAM-flexible variants. (A) Overview for the identification for plasmid junctions by PEM-seq. Purple arrows indicate the primers placed on the Cas9 target site in the genome. Plasmid junctions can be divided into two types dependent on the sequenced lengths: insertion or translocation. (B) Plasmid junctions per 100k on-target indels for SpCas9 variants at indicated NGG loci in HEK293T cells detected by PEM-seq cloning from the genomic loci. k for thousand. (C) The distribution of plasmid junctions across the plasmid backbone every 100k indels for SpCas9, eCas9 and SpRY at C-MYC locus in HEK293T cells detected by PEM-seq. Junction numbers for the U6-sgRNA region are marked above. The plasmid reference is on the top. Binsize = 100 bp. (D) Circos plot for the SpCas9 and SpRY libraries at C-MYC locus cloning from the plasmid. Translocation junctions for SpRY and SpCas9 are displayed from outside to inside, with numbers at 15 767 and 669, respectively. Genome-wide translocation junctions binned into 2-Mb regions (SpCas9: black lines and SpRY: blue lines) are plotted on a log scale. Density is labeled. Percentages of indels in the plasmid are marked on the bottom.

