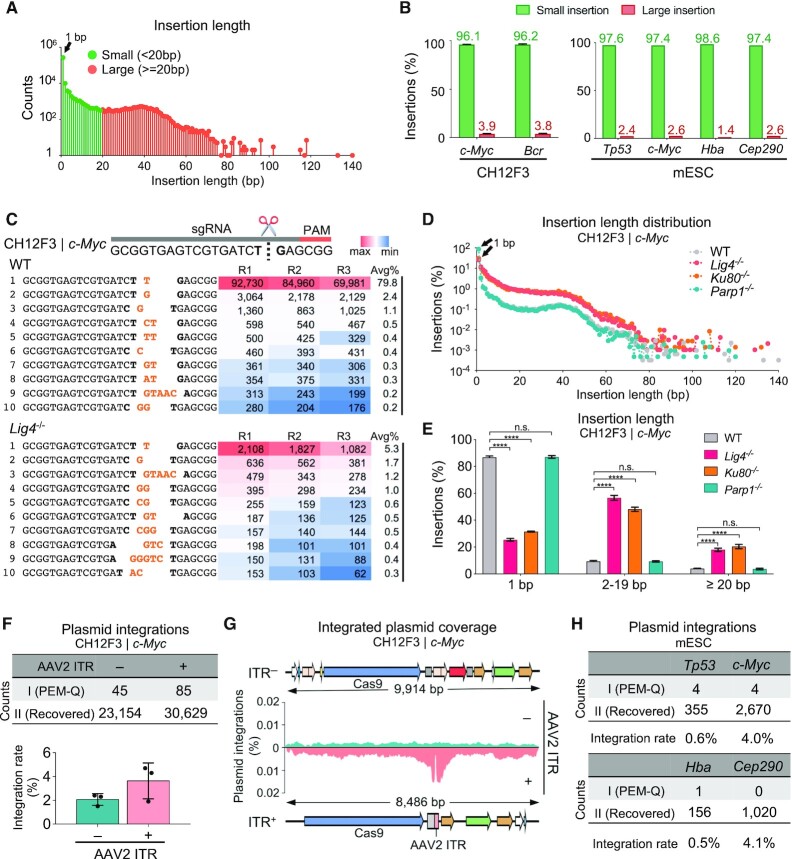
Figure 3.
Recurrent small insertions and deleterious plasmid integrations. (A) The distribution of insertions with indicated length at the c-Myc locus in CH12F3 cells. Total junctions of three repeats are plotted on a log scale. 1-bp insertion is indicated by the black arrow. (B) Percentages of small (<20 bp) and large (≥20 bp) insertions among total insertions at the c-Myc and Bcr locus in CH12F3 cells (left) and four indicated loci in mESCs (right). Error bars, mean ± SD. (C) Top 10 most frequent insertions at the c-Myc locus in WT and Lig4–/- CH12F3 cells. The target site is shown on the top. Bases at cleavage site are in bold and inserted bases are in orange. The numbers from three repeats (R1, R2, R3) and average percentages (Avg%) of each type of insertions among total insertions are listed in the table, filled with gradient color from the maximum (red) to the minimum (blue) frequencies. (D) The distribution patterns of insertion length at the c-Myc locus in CH12F3 cells with indicated backgrounds. Total junctions of three repeats are plotted on a log scale. 1-bp insertions are pointed out by the black triangles. (E) Bar chart showing the percentages of insertions with indicated length among total insertions in CH12F3 cells with indicated backgrounds. Error bars, mean ± SD. One-tailed t-test, ****P < 0.0001; n.s., not significant. (F) The numbers of plasmid integrations with (+) or without (–) AAV2 ITR at the c-Myc locus in CH12F3 cells (top). Frequencies of integrated plasmid fragments among total editing events are shown at the bottom. Error bars, mean ± SD. (G) Coverage of plasmid integrations at the c-Myc locus in CH12F3 cells with (bottom) or without (top) AAV2 ITR. (H) The numbers and rates of plasmid integrations normalized to total editing events at indicated loci in mESCs.

