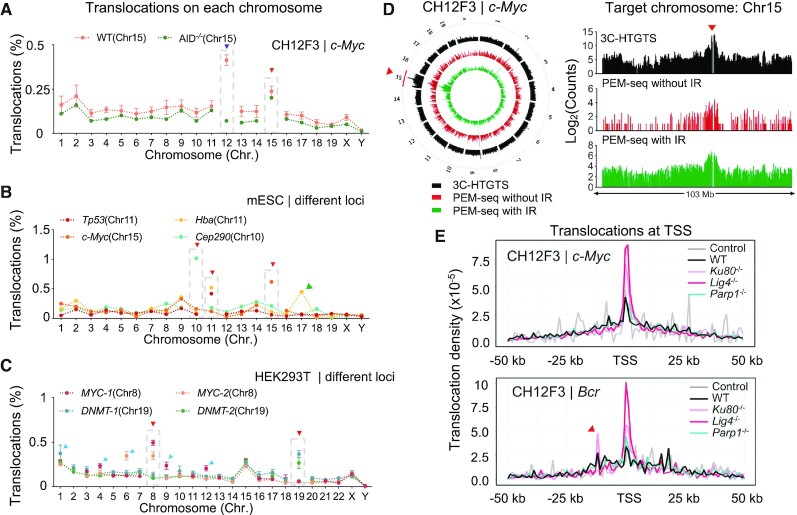
Figure 4.
Distribution profile of translocations induced by CRISPR–Cas9. (A) The distribution patterns of translocation junctions on each chromosome at the c-Myc locus in WT and AID–/– CH12F3 cells. The target chromosome Chr15 is highlighted by dashed-line boxes and indicated by the red triangle. Chr12 is indicated by a purple triangle. (B) The distribution patterns of translocation junctions at indicated loci in mESCs. The target chromosome is highlighted by dashed-line boxes and indicated by the red triangle. The green triangle indicates Hba pseudogene on Chr17. (C) The distribution patterns of translocation junctions at indicated loci in HEK293T cells. The target chromosome is highlighted by dashed-line boxes and indicated by the red triangle. Chromosomes harboring robust off-target sites are pointed by blue triangles. (D) The distribution patterns of identified junctions in the entire genome (circos plot) or Chr15 (bar graph) by 3C-HTGTS (black), PEM-seq with or without (red) IR at the c-Myc locus in AID–/- CH12F3 cells. Signals were binned into 2 Mb intervals and plotted on a log scale. The upstream and downstream 500 kb region of the c-Myc locus (indicated by a red triangle) is removed. (E) The distribution patterns of translocation junctions around TSSs in CH12F3 cells with indicated backgrounds at the c-Myc locus (top) or Bcr locus (bottom). Translocations within the IgH region are excluded for analysis. Control represents primer control libraries without Cas9 cutting. The red triangle indicates a cluster of translocation junctions within the AT rich interactive domain 1B (Arid1b) gene on Chr17.

