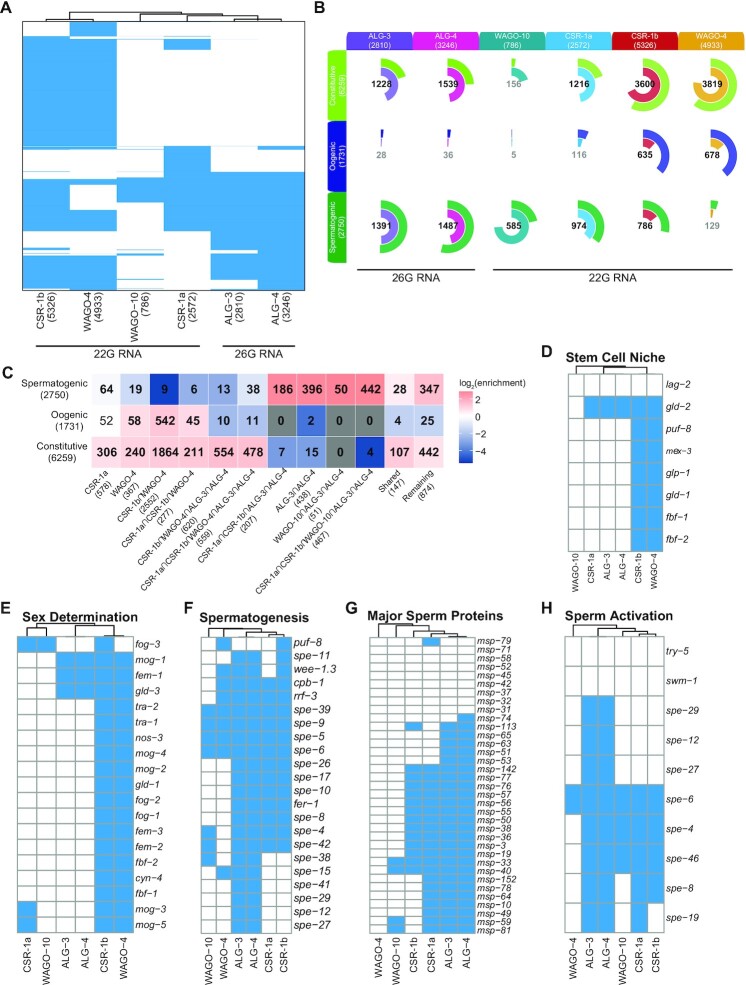
Figure 10.
Spermatogenesis AGOs target different subsets of germline genes. (A) Clustering diagram of genes targeted by 22G-RNA binding AGOs and 26G-RNA binding AGOs during the L4 stage. Each blue line represents a single gene targeted by an AGO/sRNA. There are 7137 genes in total represented. (B) Venn-pie diagrams comparing groups of genes targeted by each AGO (inner circle) with gene sets that define spermatogenesis-enriched transcripts, oogenesis-enriched transcripts, and germline constitutive (outer circle) (29). The size of each color-coded circle represents the proportion of that sample that overlaps with the other sample. Numbers in the center of the circle indicate the number of genes that overlap between the two data sets. Numbers in bold are statistically significant as calculated by Fisher's Exact Test (one sided), P< 0.05. (C) Heatmap depicting the overlap between protein coding targets of various combinations of AGOs with mutually exclusive germline constitutive, oogenic, and spermatogenic enriched transcript sets (29). Bold numbers indicate significant enrichment in overlapping genes (Fisher's Exact Test, P< 0.05). Enrichment = number of overlapping genes divided by the expected number of overlapping genes drawn from two independent groups. (D-H) Clustering diagrams for various germline and spermatogenesis pathways depicting which AGOs target which genes in each pathway: (D) Stem Cell Niche (81); (E) Sex Determination (82); (F) Spermatogenesis (22); (G) Major Sperm Proteins (83); (H) Sperm Activation (84).

