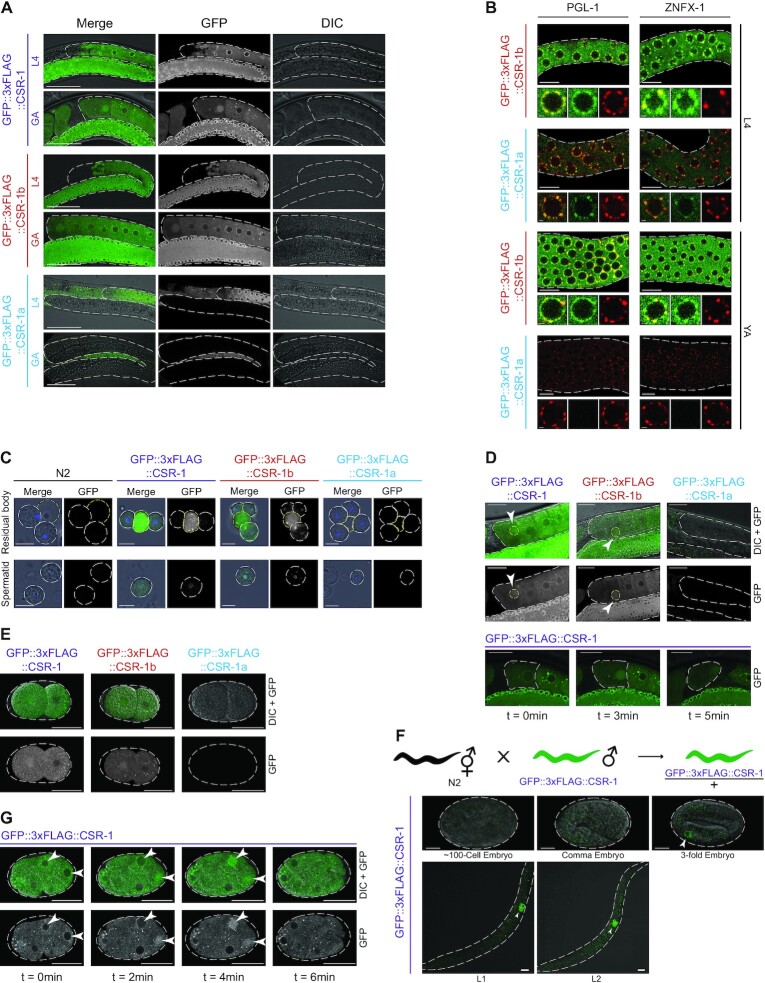
Figure 2.
CSR-1a and CSR-1b isoforms are differentially expressed in the germline. (A) Fluorescence micrographs of animals in L4 and gravid adult (GA) stages expressing GFP::3xFLAG::CSR-1, GFP::3xFLAG::CSR-1b and GFP::3xFLAG::CSR-1a in the germlines. Scale bar, 50 μm. (B) Fluorescence micrographs of L4 and young adult (YA) germlines expressing GFP::3xFLAG::CSR-1b and GFP::3xFLAG::CSR-1a (green), along with either PGL-1::mRFP or HA::TagRFP::ZNFX-1 (red). Top panels show the pachytene region of each germline, and bottom panels show a single nucleus. Note that CSR-1a is not expressed in the YA stage. Scale bar, 10 μm in top images, 1 μm in bottom images. (C) Fluorescence micrographs of residual bodies (outlined in yellow) and spermatocytes (top) spermatids(bottom) (both outlined in white) from animals expressing GFP::3xFLAG::CSR-1, GFP::3xFLAG::CSR-1b and GFP::3xFLAG::CSR-1a and stained with DAPI (blue in Merge), compared to wild-type (N2) animals. Scale bar, 5 μm. (D) Fluorescence micrographs showing localization of endogenously tagged CSR-1 isoforms in oocytes (top) and time lapse of endogenously tagged CSR-1 localization in the -1 oocyte over the course of five minutes (bottom). Scale bar, 25 μm. (E) Fluorescence micrographs showing expression of endogenously tagged CSR-1 isoforms and total CSR-1 (reflecting CSR-1b expression) in 2-cell embryos prior to the onset of zygotic expression. Scale bar, 25 μm. (F) Fluorescence micrographs showing zygotic expression of GFP::3xFLAG::CSR-1 in embryos, and L1 and L2 animals. Embryos were generated from crosses of wild-type hermaphrodites to gfp::3xflag::csr-1 males. Scale bar, 10 μm. (G) Fluorescence micrographs showing a time lapse of nuclear localization of endogenously tagged CSR-1 (reflecting CSR-1b expression) in a developing 8-cell embryo over the course of 6 min. Scale bar, 25 μm.

