Figure 6.

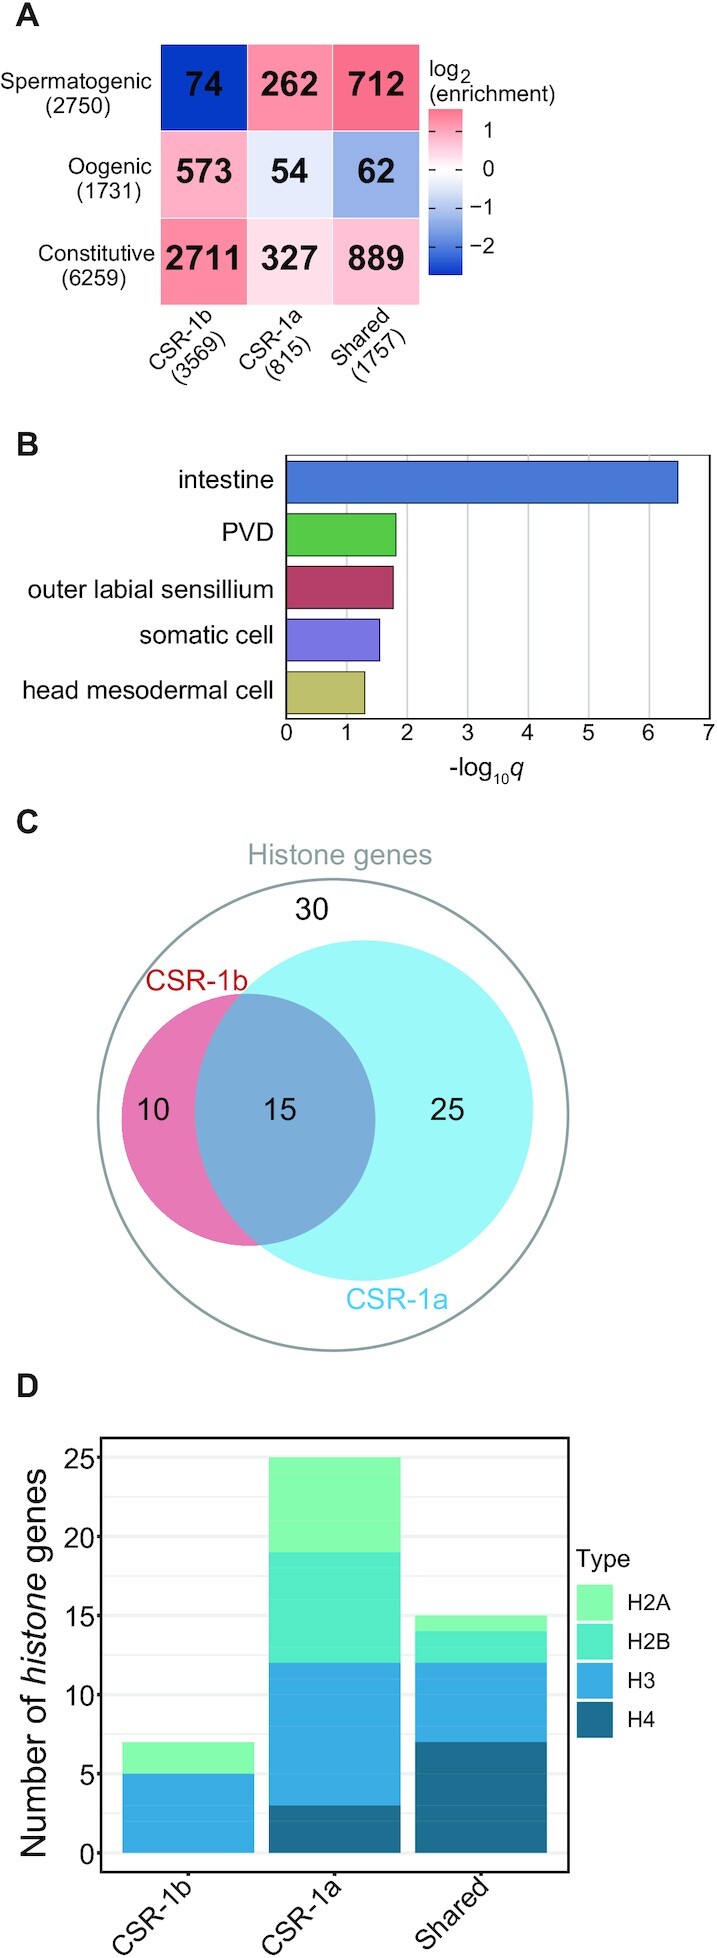
CSR-1 isoforms target shared and distinct sets of genes. (A) Heatmap depicting the overlap between 22G-RNA protein coding targets of CSR-1b only, CSR-1a only, and shared targets with mutually exclusive germline constitutive, oogenic, and spermatogenic enriched transcript sets (29). Bold numbers indicate significant enrichment in overlapping genes (Fisher's Exact Test, P< 0.05). Enrichment = number of overlapping genes divided by the expected number of overlapping genes drawn from two independent groups. (B) Tissue enrichment analysis of the 268 CSR-1a targets that do not overlap with the sets of germline transcripts in (A). (C) Venn diagram of core histone genes enriched in the IPs for CSR-1b (red) and CSR-1a (blue), relative to all core histone genes in C. elegans. (D) Bar graph showing the distribution of types of core histone genes enriched in each CSR-1 isoform IP.
