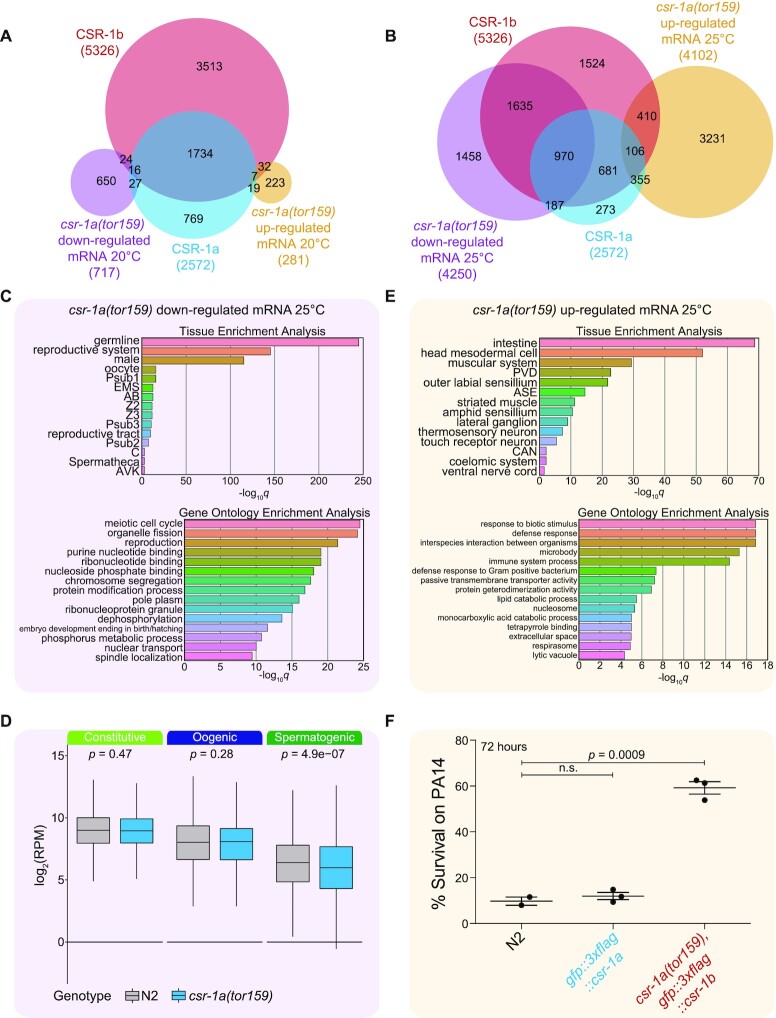
Figure 7.
Loss of csr-1a affects different sets of genes in different tissues. (A-B) Venn diagrams showing the overlap between genes that are differentially expressed in csr-1a(tor159), gfp::3xflag::csr-1b (simply referred to here as csr-1a(tor159)) vs. wild-type worms at 20°C (A) (up-regulated genes: orange, down-regulated genes: purple) and 25°C (B) with the 22G-RNA targets defined by CSR-1a and CSR-1b IPs. (C) Tissue enrichment analysis (top) and Gene Ontology analysis (bottom) for genes that are down-regulated in csr-1a(tor159) vs. wild-type worms at 25°C. (D) Analysis of RPM in csr-1a(tor159) (blue) vs. wild-type worms (pink) at 25°C for genes in the germline constitutive, oogenic, and spermatogenic groups (29). (E) Tissue enrichment analysis (top) and Gene Ontology analysis for genes that are over-expressed in csr-1a(tor159) vs. wild-type worms at 25°C (F) Survival of worms at 72 hours treatment with Pseudomonas aeruginosa (PA14) in slow killing assays. Each data point represents one experiment, starting from at least 50 worms. Comparisons between samples were made using two-tailed t-tests.

