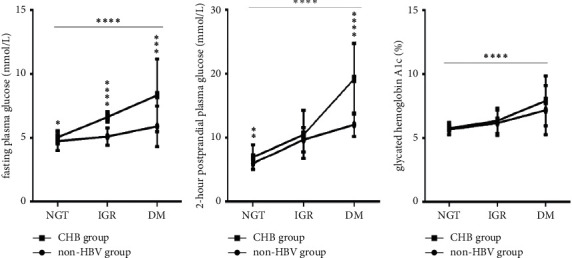
Figure 2.

Comparison of the glucose metabolism parameters between the two groups under NGT, IGR, and DM conditions (n = 220; NGT, IGR, and DM in the two groups, n = 50, 30, and 30, respectively). (a) FPG levels; (b) 2h-PG levels; (c) HbA1c. FPG, fasting plasma glucose; 2h-PG, 2-hour postprandial glucose; HbA1c, glycated hemoglobin A1c; NGT, normal glucose tolerance; IGR, impaired glucose regulation; DM, diabetes mellitus; CHB, chronic hepatitis B; HBV, hepatitis B virus. Two-way ANOVA was used for the interaction comparison ((a)–(c), all P < 0.0001). One-way ANOVA was used for intragroup comparisons ((a)–(c), all P < 0.0001). Unmatched t-tests were used for the intergroup comparisons. ∗P < 0.05, ∗∗P < 0.01, ∗∗∗P < 0.001, and ∗∗∗∗P < 0.0001.
