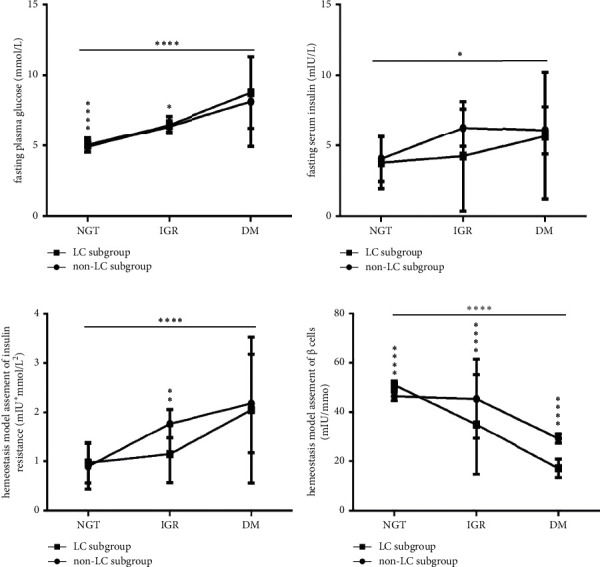
Figure 4.

Comparison of glucose metabolism parameters between the non-LC and LC CHB subgroups under NGT, IGR, and DM conditions (n = 110; NGT, IGR, and DM in non-LC subgroup, n = 42, 12, and 15, respectively; in LC subgroups, n = 8, 18, and 15, respectively). (a) FPG levels; (b) FINS levels; (c) HOMA-IR values; (d) HOMA-β values. FPG, fasting plasma glucose; FINS, fasting serum insulin; HOMA-IR, homeostasis model assessment of insulin resistance; HOMA-β, homeostasis model assessment of β cell function; NGT, normal glucose tolerance; IGR, impaired glucose regulation; DM, diabetes mellitus; CHB, chronic hepatitis B; HBV, hepatitis B virus; LC, liver cirrhosis. Two-way ANOVA was used for the interaction comparison ((a), P < 0.05; (d), P < 0.0001). One-way ANOVA was used for intragroup comparisons ((a), (c), and (d), all P < 0.0001; (b), P < 0.05). Unmatched t-tests were used for the intergroup comparisons. ∗P < 0.05, ∗∗P < 0.01, and ∗∗∗P < 0.001.
