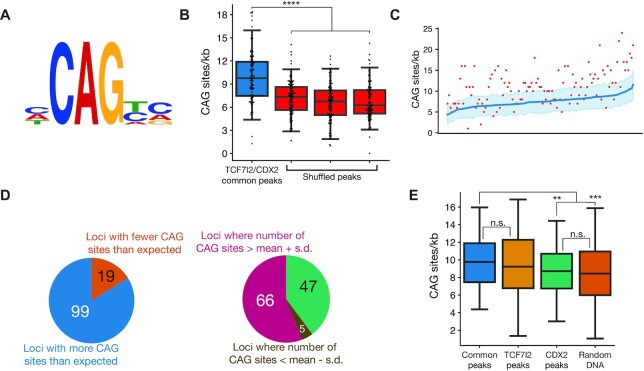
Figure 7.
CAG sites are enriched at loci bound by TCF7L2 and CDX2. (A) Site logo of functionally validated CAG sites identified in the CREAX and c-Myc-335 WREs. (B) Distribution of CAG sites in regions bound by TCF7L2 and CDX2 in colorectal cancer cells from Verzi et al. Each data point shows the number of CAG sites per kb in a single ChIP-chip peak. A search for CAG sites was performed in 3 shuffled versions of each peak's sequence to see if there was an enrichment of the CAG site motif in these sites. (C) CAG sites are enriched in loci bound by TCF7L2 and CDX2. Actual number of CAG sites identified by FIMO are shown in the red scatter plot. The number of CAG sites was calculated in 100 shuffled variants of the sequence of each locus, and the blue line shows the average number of CAG sites in these variants. The shaded region represents the standard deviation in the number of CAG sites (N = 100). (D) 99 (83.9%) of loci bound by both TCF7L2 and CDX2 had more than the expected number of CAG sites. The CAG site count was more than one standard deviation above the mean in 66 of those loci. (E) Box plots showing the number of CAG sites in loci bound by both TCF7l2 and CDX2, only TCF7l2, only CDX2, and randomly selected genomic regions in colorectal cancer cells. P< 0.05; **P< 0.005; ***P< 0.001; ****P < 0.0001; n.s. P > 0.05.

