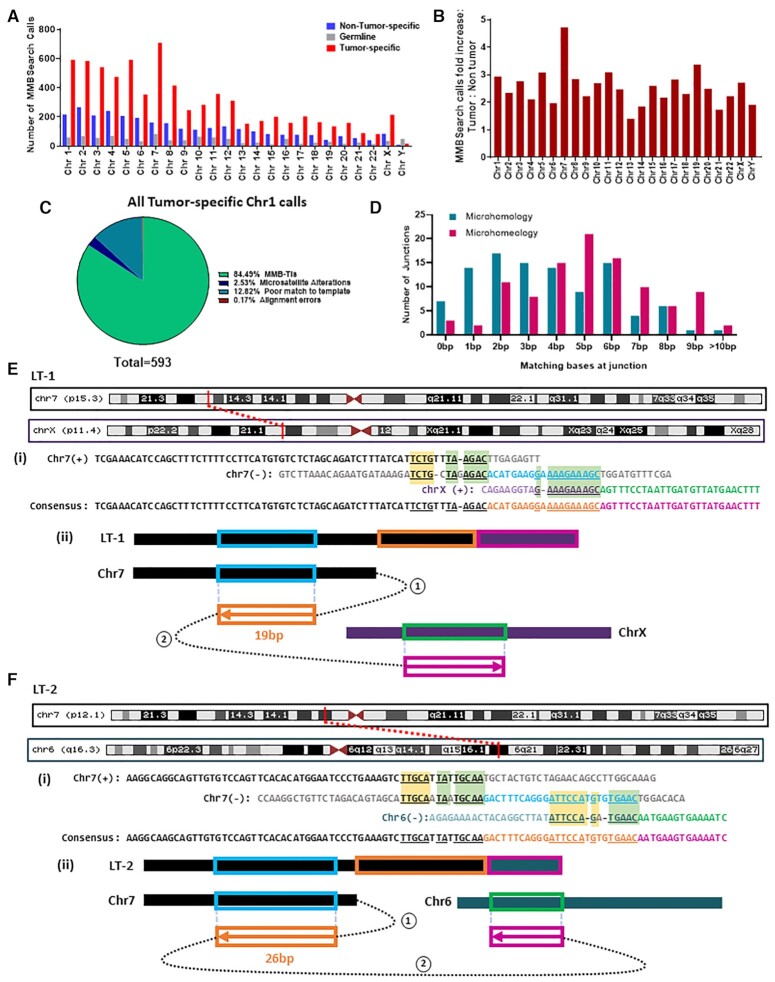
Figure 4.
MMB-TIs accumulate in a Lung adenocarcinoma case from dbGaP (accession ID: phs000488.v2.p1). (A) MMBSearch calls per chromosome for lung tumor (SRA run ID: SRR556475) and matched non-tumor (SRA run ID: SRR551334) tissue samples. (B) Fold-increase of MMBSearch calls in tumor specific-calls compared to non-tumor-specific calls (for the samples shown in A) normalized to the total number of reads for each individual sample. (C) Analysis of all MMBSearch calls on Chromosome 1 for lung tumor (n = 593). Events were detected using identical parameters to those used in analysis for Figure 3C. (D) Microhomology and microhomeology distribution for MMB-TI event junctions from Chromosome 1 (n = 103) of the same lung tumor sample. (E) MMB-TI event LT-1 found on p15.3 band of Chromosome 7 that is fused with the p11.4 band of Chromosome X. (i) Alignment of event LT-1 consensus to all reference templates. Insertion consists of two parts (orange and pink text) copied from two corresponding templates (light blue and green respectively). Chromosome 7 sequence is shown in black text, and Chromosome X sequence is shown in purple. Microhomology used in each template switching event is underlined and highlighted in light green boxes, and additional microhomology is highlighted in yellow boxes. (ii) Schematic illustrating template switching events that lead to the formation of LT-1. Circled numbers indicate order of template switches, Boxed arrows indicate direction of synthesis, numbers above boxes indicate length of synthesis, and colors correspond to those in (i). (F) MMB-TI LT-2 found on p12.1 band of Chromosome 7 that is fused with the q16.3 band of Chromosome 6. (i) Alignment of event LT-2 consensus to all refence templates. Chromosome 7 sequence is shown in black text, and Chromosome 6 sequence is shown in teal. Other text colors and highlights similar to those in (E, i). (ii) Schematic illustrating template switching events that lead to the formation of LT-2. Circled numbers indicate order of template switches, Boxed arrows indicate direction of synthesis, numbers below boxes indicate length of synthesis, and colors correspond to those in (i).

